
Where Are The Expected Returns?
Systematically Scanning Across DM Equities, Bonds, FX and Commodities

Expected returns form the foundation of all investing. We invest in assets that are at a discount to their expected future value and earn compensation for bearing uncertainty around that outcome. The expected compensation for bearing this risk is the source of returns in investing. While most asset classes exhibit positive expected returns over long horizons, those returns are not static, but time-varying. When realized returns on assets rise relative to their expected value, the future expected return on assets falls. Conversely, when realized returns on assets fall relative to their expected value, they potentiate future returns. Adapting our asset allocation based on these time-varying return characteristics to maximize our expected returns offers a durable and consistent return stream.
Below, we visualize the systematic application of these principles of expected returns to a diversified portfolio of equities, fixed income, commodities, and currencies across developed markets:
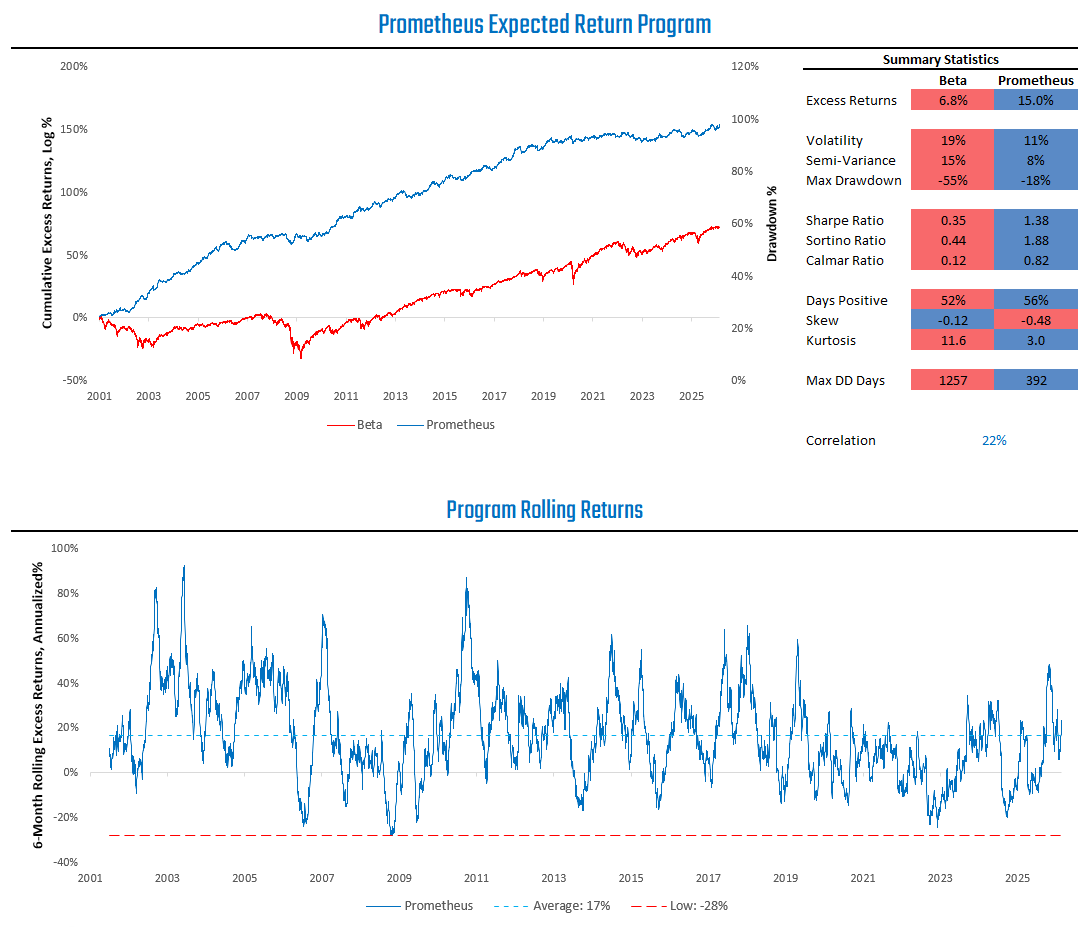
Above, we visualize returns by systematically adjusting our exposure to the expected returns of a developed-market (DM) asset basket. This DM basket contains the equities, sovereign bonds, and currencies of the US, Canada, UK, Japan, Germany, and Australia, along with global commodity exposures in WTI Crude, Brent Crude, Heating Oil, Gasoil, Copper, and Aluminium.
In this note, we outline the framework for our portfolio construction process and describe what it reveals about the global cross-asset expected-return landscape.
The Framework
In this section, we will outline the framework for systematically constructing our portfolio. The purpose of this section is not to give a step-by-step process for replicating this portfolio, but rather to offer the mechanical framework used in portfolio construction in an intuitive fashion. We visualize our portfolio construction process below:
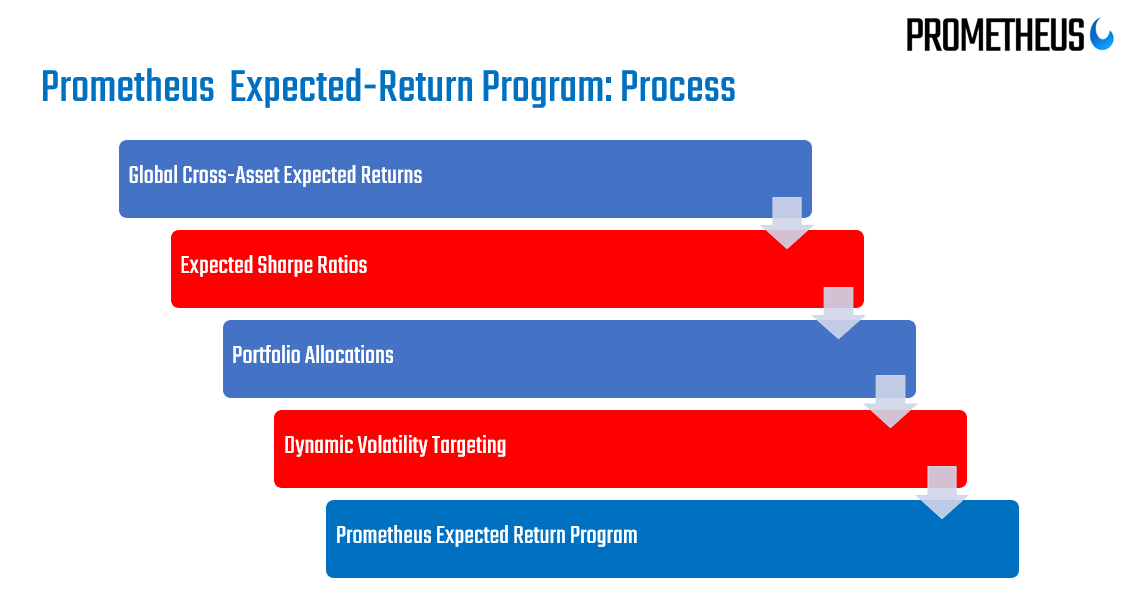
Expected Return Measures: While conceptually expected returns are uniform across asset classes, in practice, their definitions vary. We use a combination of earnings yields (equities), bond yields (fixed income), the term structure (commodities), and rate differentials (currencies) to define expected returns. We treat gold as a currency and use a mix of the long-term realized return and real yields to measure expected returns. These measures are intentionally simple but defensible to align with discretionary intuition.
Naive Expected Sharpe Ratios: Using our expected return measures, we compute naive expected Sharpe Ratios based on local volatility levels. Our preference here is for shorter-horizon volatility lookbacks, as they better account for volatility clustering. These naive expected Sharpe Ratios are not intended as short-term timing signals, but rather as structurally grounded measures of forward risk-adjusted return.
Portfolio Allocations: Portfolio allocations are scaled proportionally to our naive Sharpe Ratios. All assets in the portfolio trade in large, liquid futures markets. As a result, the program is not subject to structural leverage constraints and is unconstrained in expressing long or short exposures.
Dynamic Volatility Targeting: The program maintains a maximum risk budget of 10% annualized volatility. The aggregate naive expected Sharpe Ratio scales portfolio-level exposure. A higher expected risk-adjusted return increases utilization of the risk budget, while a lower expected risk-adjusted return reduces exposure.
Combining these measures creates the Prometheus Expected Return Program for DM Markets. Let’s dive into the empirics and what they tell us about the global macro landscape today.
Equities: Anywhere But The US
We begin our exploration with DM equity markets. Below, we visualize the equal-weighted expected return profile of DM equity markets:
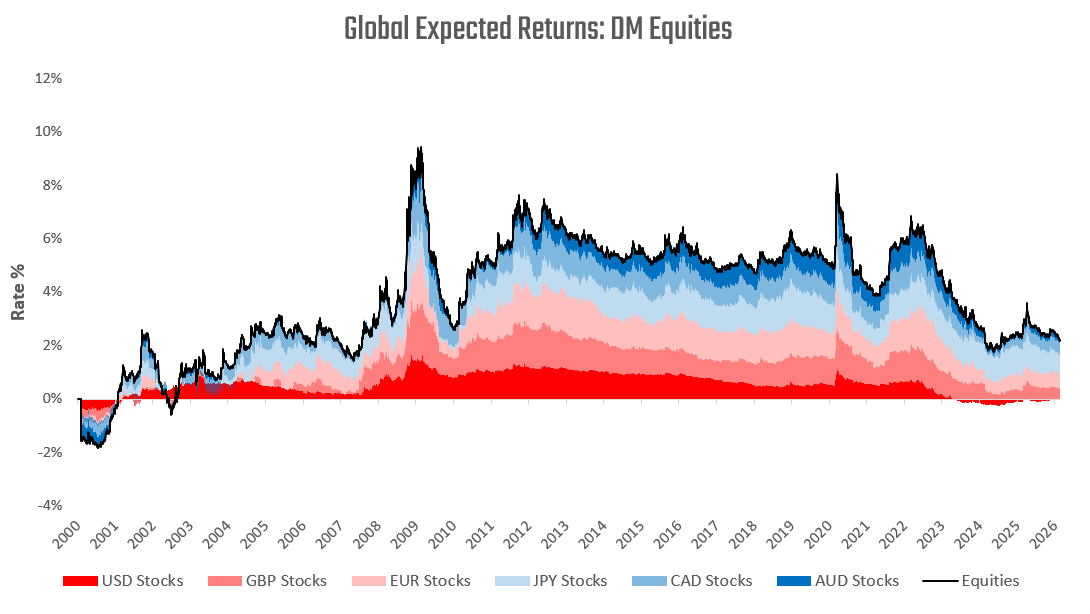
Above, we show that a DM equity basket offers positive excess returns relative to local cash rates. While positive and attractive, these expected returns are not particularly elevated relative to history, largely because realized returns in global equity markets have been high (recall that expected returns fall as realized returns rise). This basket of expected returns has been materially weighed down by US expected returns, which are effectively at zero. Meanwhile, economies with less tech-centric indexes like the UK and EU (Germany) show far more attractive return-to-risk characteristics.
Importantly, this dispersion is somewhat structural rather than cyclical. US equities have experienced a multi-year valuation expansion concentrated in a narrow group of high-growth, high-duration technology companies. As valuations rise, forward earnings yields compress mechanically, reducing embedded expected returns even if growth expectations remain strong. In contrast, UK and European indices are more heavily weighted toward financials, industrials, energy, and materials—sectors that trade at lower multiples and whose valuations have not expanded as much. As a result, their forward earnings yields remain elevated, producing higher mechanically derived expected returns.
We visualize this uneven distribution of Naive Expected Sharpe Ratios below:
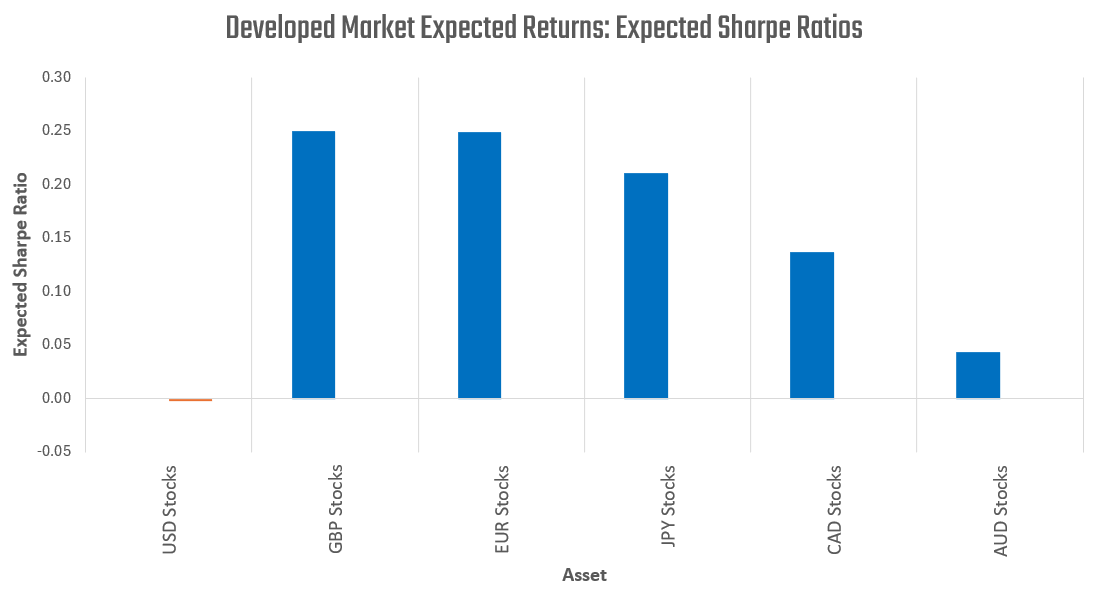
Correlations across these equity markets are fairly strong; combining these assets into a portfolio offers only a mild improvement in expected risk-adjusted returns. Nonetheless, owning a basket of these equities offers a better exposure than owning any single one. Below, we show the naive expected Sharpe ratio of our portfolio of these equities:
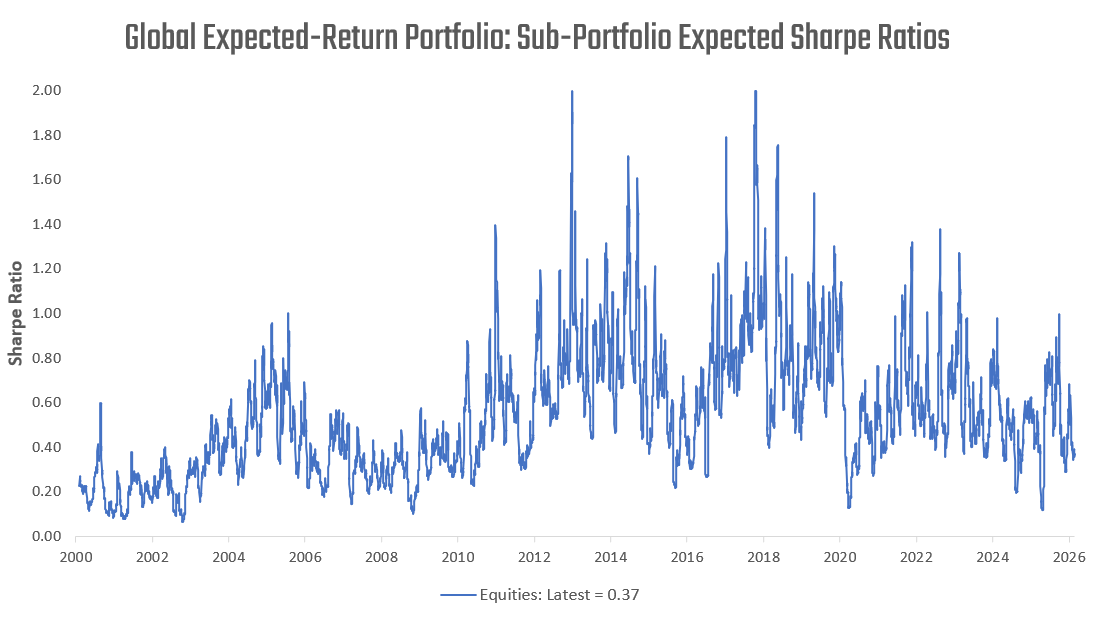
We note three important features here. First, a global equity portfolio offers higher expected returns than a US-only portfolio— a crucial observation for US investors. Second, a mix of assets is likely to outperform any one particular asset. Finally, a mix of global equities, while more attractive than owning any individual country, offers only modest expected returns relative to history.
Fixed Income: The Most Attractive Asset Class
We next turn to developed market sovereign bond markets. Below, we visualize the equal-weighted expected return profile of DM fixed income markets.
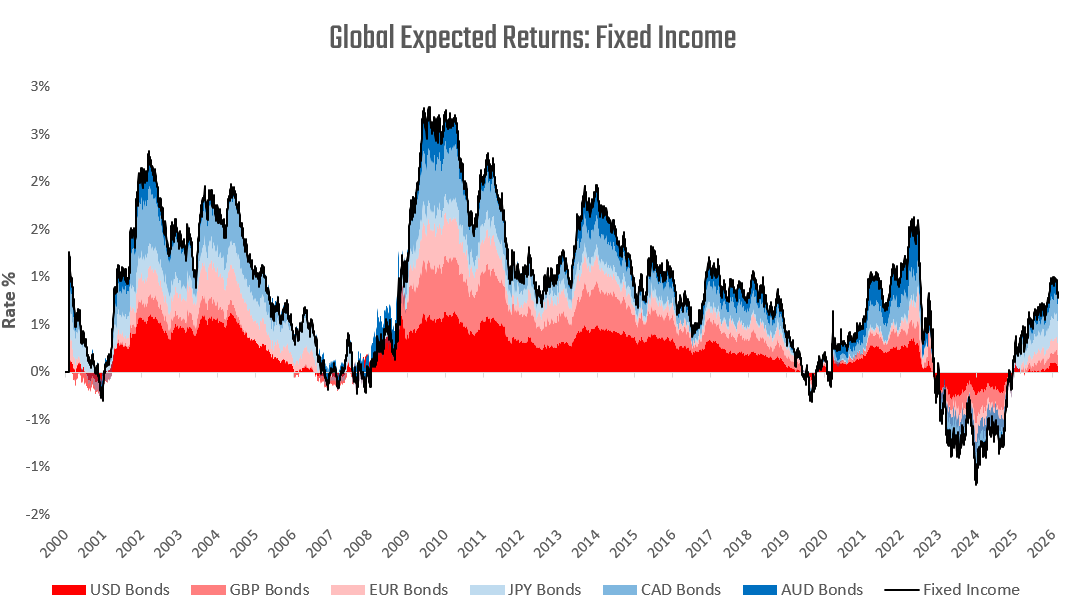
Above, we show that a DM bond basket offers modest positive excess returns relative to local cash rates. While the opportunity set has improved materially from the deeply negative expected returns observed during the global post-COVID monetary policy hiking cycle, current expected returns remain moderate relative to history.
Importantly, dispersion across countries is again material. Markets such as Japan and Canada offer yields much more attractive than those in the US. These yield differentials largely reflect much more significant inflationary pressures in these regions relative to the US, resulting in weak realized returns. However, these weak realized returns potentiate future returns. Therefore, if these countries do not experience further inflationary acceleration, bondholders will be materially rewarded relative to US bondholders.
We visualize the distribution of Naive Expected Sharpe Ratios below:
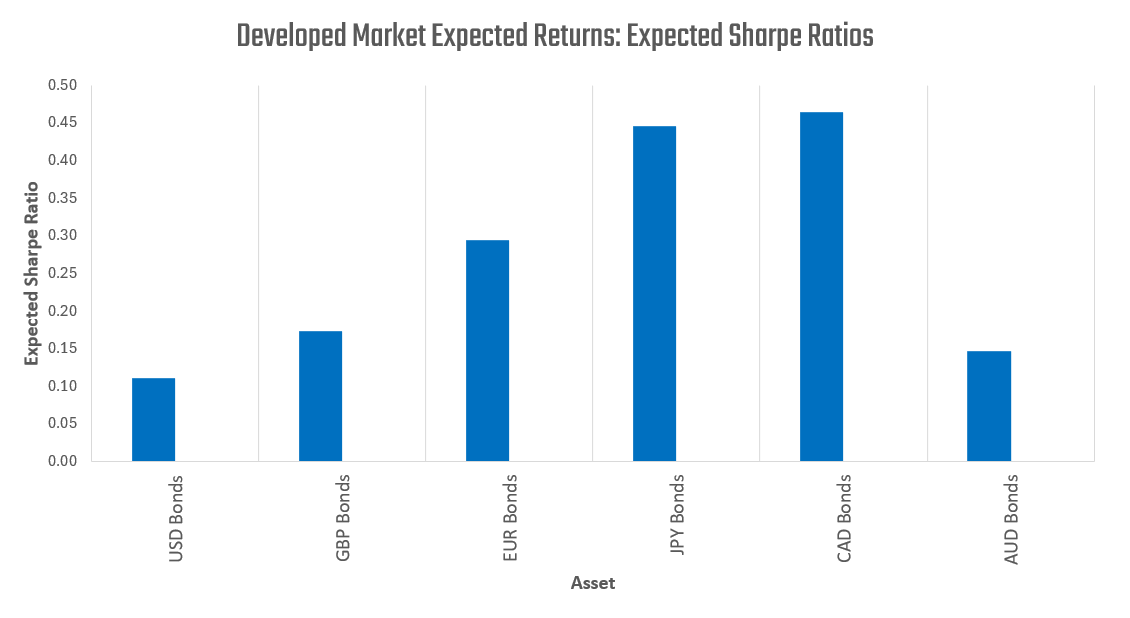
Correlations across developed bond markets are also relatively strong, though generally lower than in equities. Combining these markets into a portfolio provides some diversification benefit, but the improvement in expected risk-adjusted return is again incremental. Nonetheless, a basket of developed sovereign bonds offers a more balanced exposure than any single market, smoothing country-specific policy and inflation risk.
Below, we show the naive expected Sharpe ratio of our portfolio of these bonds:
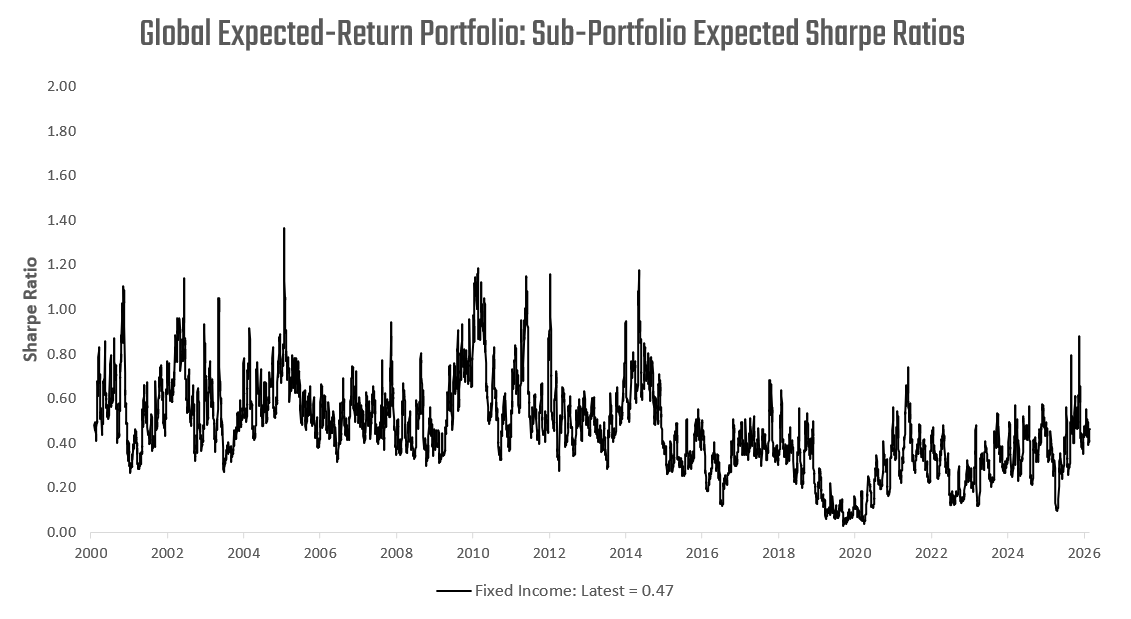
We note three important features here. First, a global bond portfolio currently offers a meaningfully higher expected return profile than we have seen in the post-COVID era. Second, cross-country diversification modestly improves risk-adjusted return relative to holding any individual bond market. Finally, fixed income offers a higher expected return than equities on a risk-matched basis, while offering a hedge to weaker growth conditions, which makes an expected return weighted portfolio of fixed income assets a compelling addition to our equity basket.
Currencies: Broadly Long USD
We next turn to developed market currency markets. Below, we visualize the equal-weighted expected-return profile of DM currencies through a dollar-centric lens:
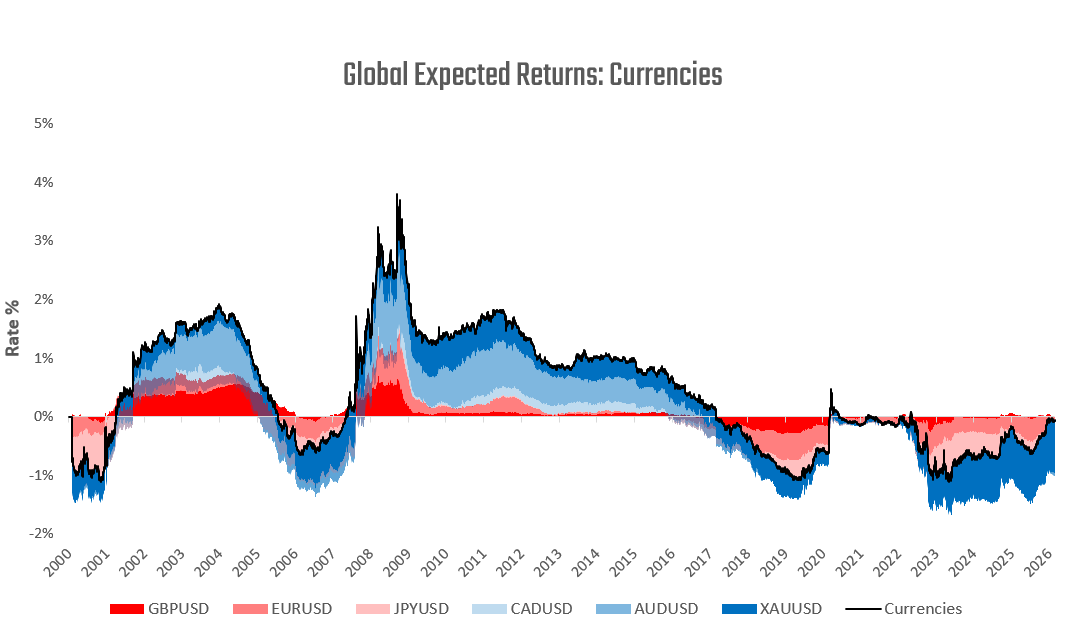
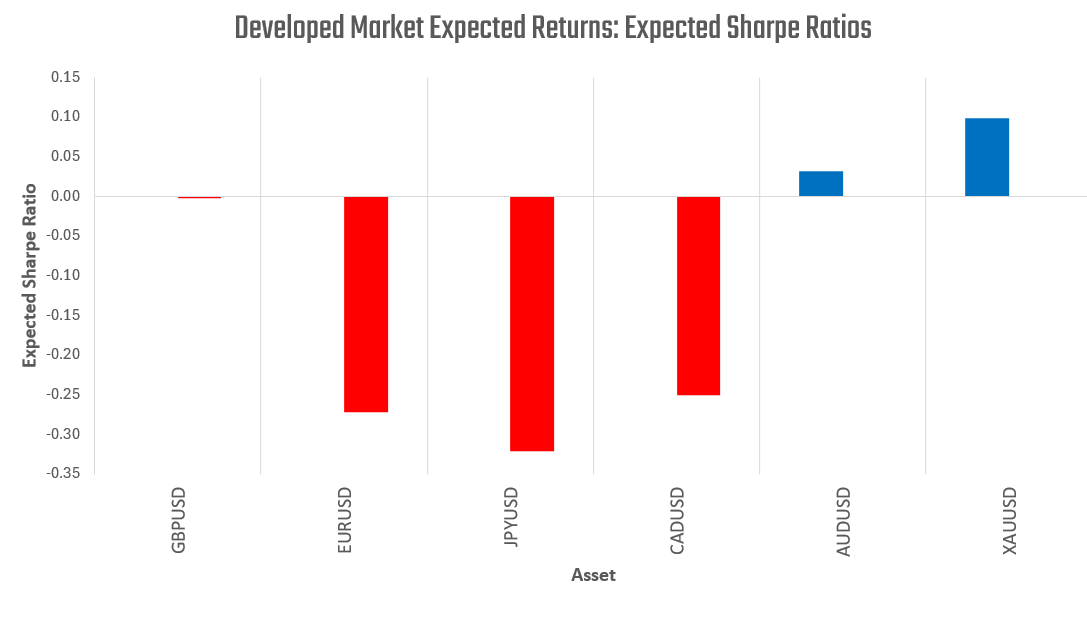
Above, we show that our non-USD currency basket currently offers a modestly negative expected return profile. However, unlike equities and bonds, we find much more dispersion in currency expected returns. This is primarily driven by the variation in monetary policy measures across global central banks. In practice, short-rate differentials are the dominant driver of this dispersion. The wide gap between US and Japanese policy rates continues to embed a meaningful carry advantage for USD over JPY, reflecting the Bank of Japan’s comparatively accommodative stance relative to the Federal Reserve. In contrast, both Canada and the Euro Area have policy rates that are closer to US levels, though meaningful differentials persist. In the case of gold, real yields remain elevated relative to history, offering modest expected returns compared with cash. These varying dynamics create a healthy amount of dispersion in the distribution of Naive Expected Sharpe Ratios :
Correlations across developed currency pairs are meaningful but structurally lower than in equities or sovereign bonds. As a result, combining currencies into a portfolio offers somewhat greater diversification benefits than within-region equity or bond baskets. Nonetheless, the improvement in expected risk-adjusted return remains incremental. A diversified currency basket primarily smooths idiosyncratic policy and rate-cycle exposure rather than dramatically increasing expected Sharpe. Below, we show the naive expected Sharpe ratio of our portfolio of these currencies:
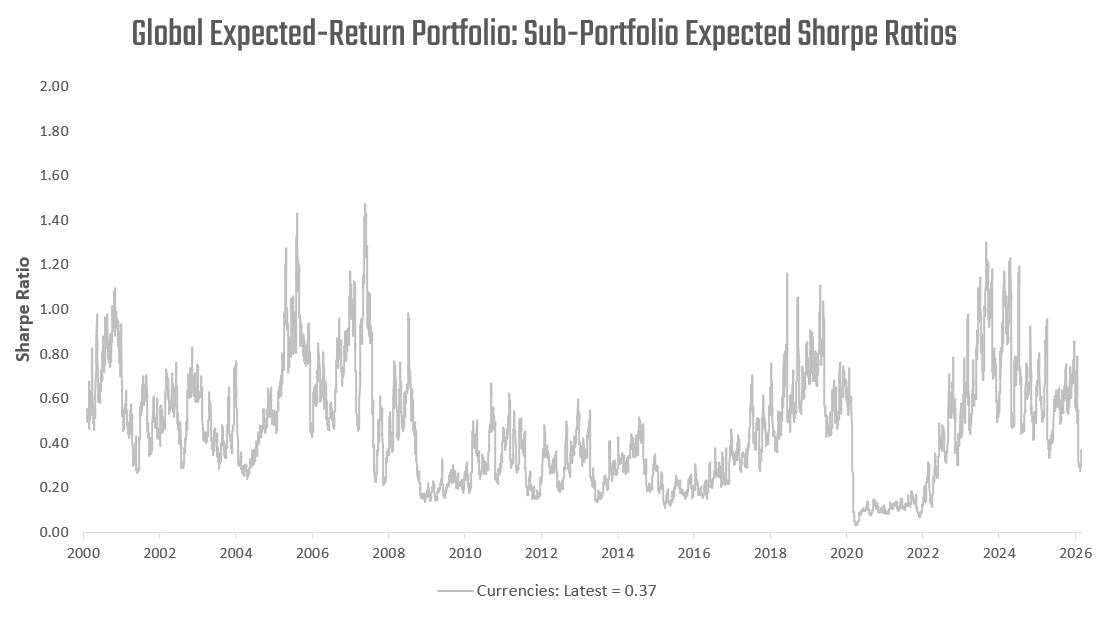
We note that the naive expected Sharpe ratio for a portfolio of currencies yields returns similar to those of equities today, while adding diversification.
Commodities: Energy Looks Attractive
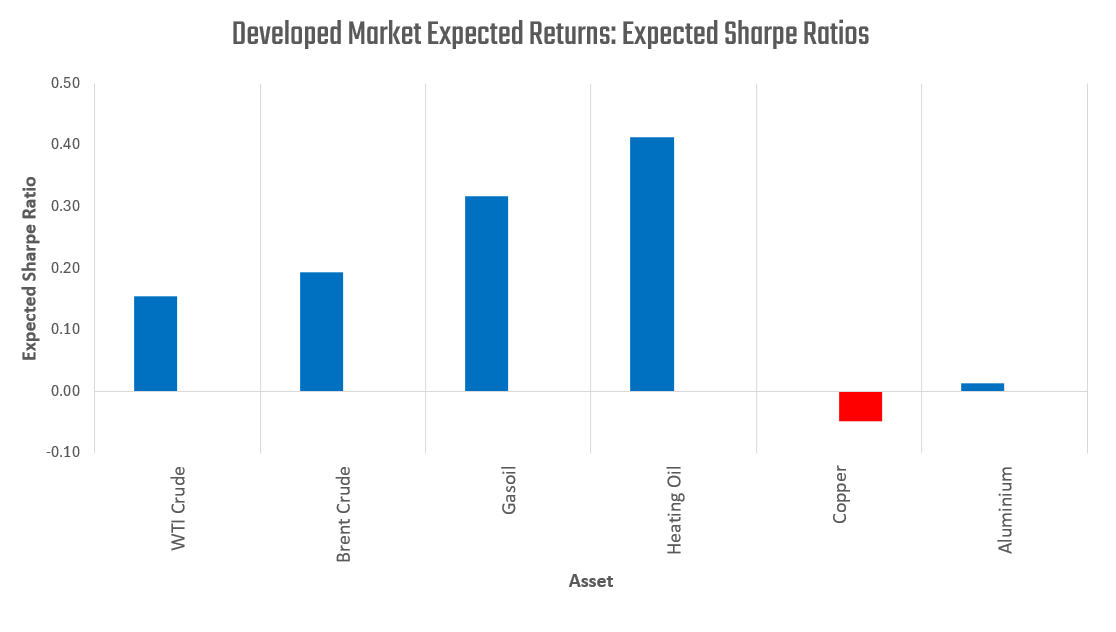
We next turn to global commodity markets. Below, we visualize the equal-weighted expected return profile of major commodity contracts across energy and industrial metals.
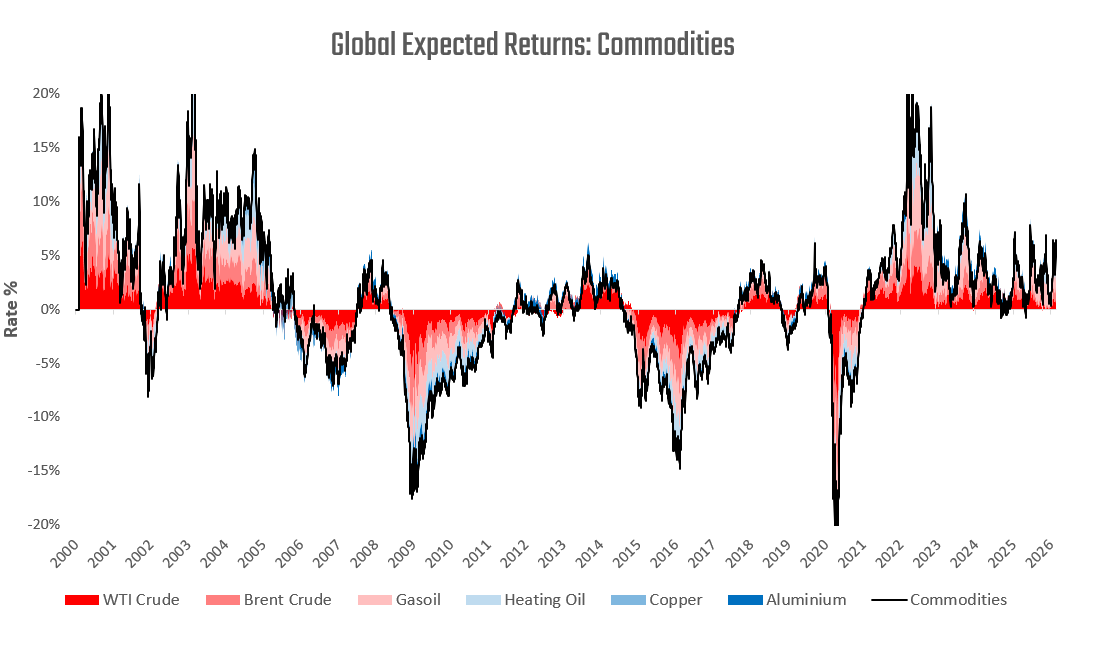
Above, we show that the commodity basket currently offers a modestly positive expected return profile, though with significant cross-asset dispersion. Unlike equities and bonds, where valuation metrics evolve gradually, commodity expected returns are largely driven by term structure dynamics and inventory conditions. Periods of backwardation embed positive roll yield and therefore positive expected returns, while contango environments mechanically compress forward return potential.
Importantly, dispersion across individual commodities is pronounced. Energy contracts—particularly refined products such as heating oil and gasoline—exhibit stronger expected Sharpe Ratios, reflecting tighter physical markets and supportive term structures. By contrast, industrial metals such as copper and aluminum display weaker or even slightly negative expected return profiles, consistent with softer demand dynamics and flatter or contangoed curves. We visualize the distribution of Naive Expected Sharpe Ratios below:
Correlations across commodities are lower than within regional equity or bond markets, though still influenced by broad macro cycles. Combining commodities into a basket provides diversification benefits and smooths idiosyncratic supply shocks, but dispersion remains an important feature of the opportunity set. Below, we show the naive expected Sharpe ratio of our commodity sub-portfolio:
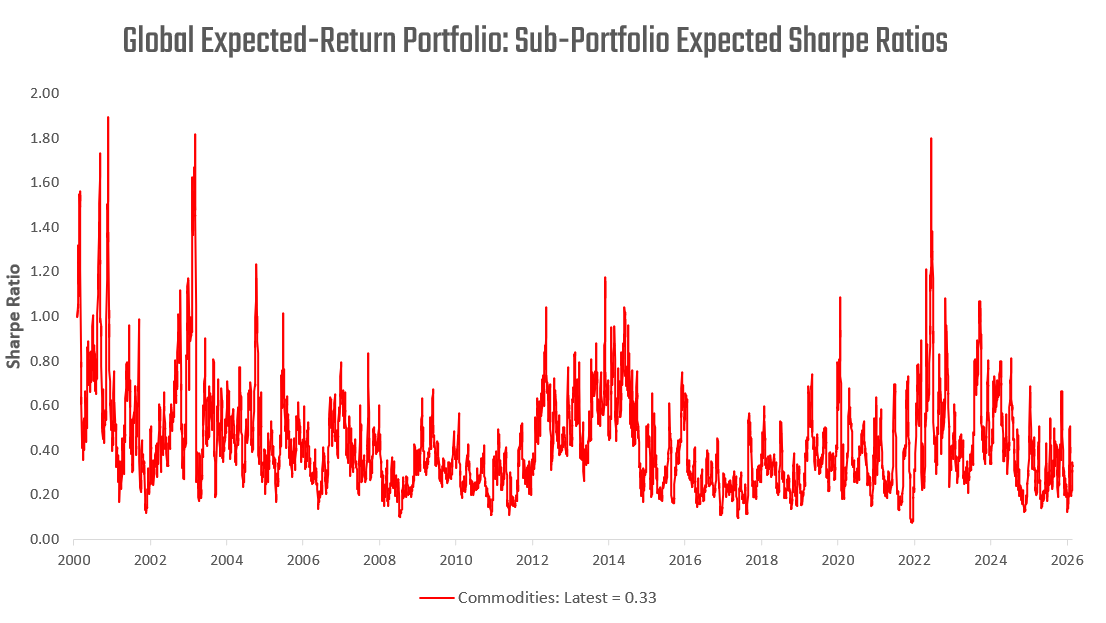
Unlike equities and fixed income, the carry embedded in the term structure of the commodities curve is not as mechanically linked to forward returns, and does not offer a persistently positive risk premium. Furthermore, after accounting for asset volatilities, our naive expected Sharpe ratios are not as compelling as a simple look at the term structure may imply. Nonetheless, a portfolio of commodities is undoubtedly value-additive to a global expected return portfolio.
Prometheus Expected-Return Program
So far, we have examined each asset class within our DM basket individually. We now combine these sub-portfolios to form the Prometheus Expected-Return Program. Below, we visualize portfolio risk allocation across the 24-asset universe:
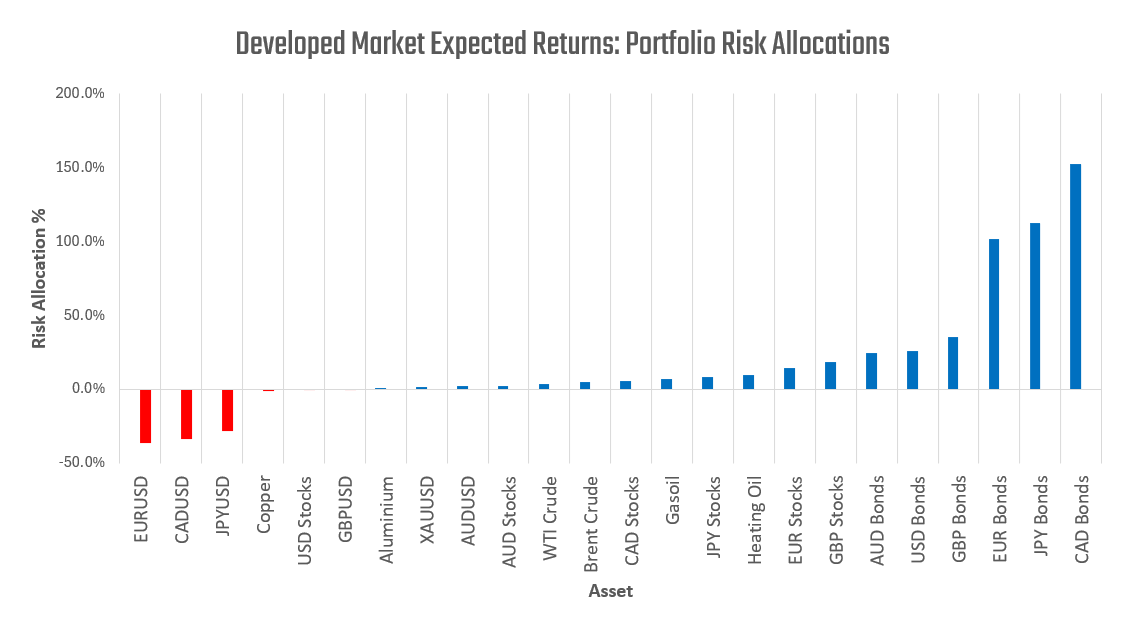
Above, portfolio risk allocation refers to the notional exposure of each position scaled by its expected volatility. Capital is directed toward assets offering the highest expected return per unit of risk, while total portfolio risk is moderated through diversification.
We offer two perspectives to quantify this diversification benefit. First, we compare the aggregate naive expected portfolio Sharpe Ratio (blue) to the simple average Sharpe Ratio of the underlying asset classes (red):
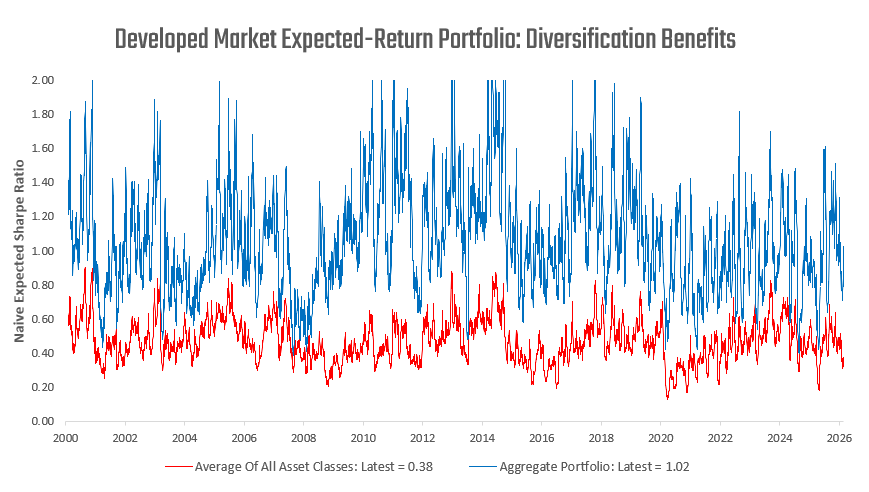
Diversification does not change expected return; it reduces volatility. If all asset classes were perfectly correlated, there would be no diversification benefit, and the blue and red lines would coincide. The greater the gap between the aggregate Sharpe and the average Sharpe, the larger the diversification benefit.
Second, we measure diversification through the portfolio’s effective number of bets. While the program spans 24 assets, correlations across markets reduce the true number of independent return streams. The chart below shows how the effective number of bets evolves over time. When correlations rise, breadth compresses. When cross-asset opportunities become more dispersed, breadth expands. This increase in independent exposures lowers portfolio volatility relative to expected return and strengthens aggregate risk-adjusted performance.
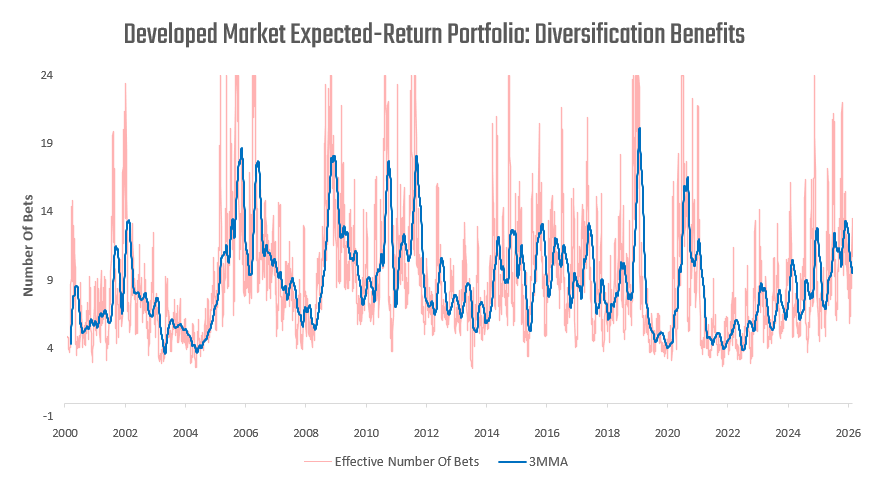
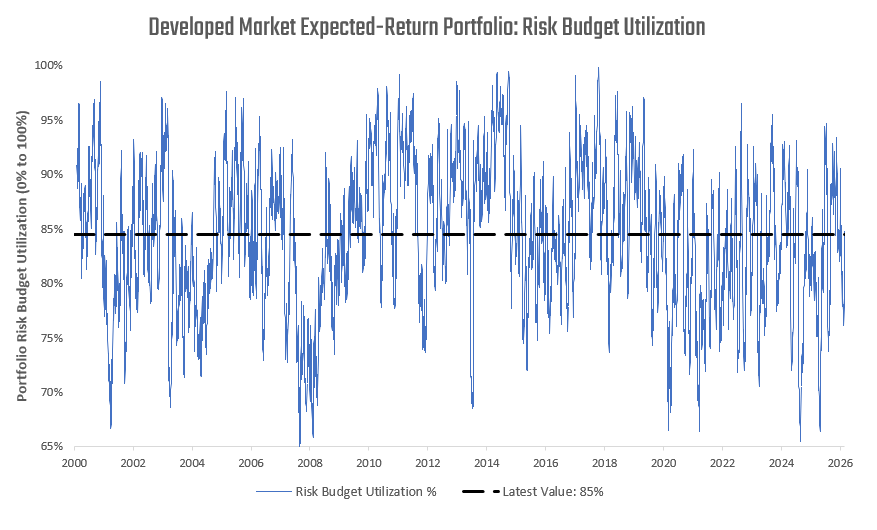
The program currently exhibits a meaningful level of effective breadth relative to history. The combination of cross-asset dispersion and diversification benefits supports a healthy utilization of the portfolio risk budget, as shown below.
Thus, after systematically scanning across the global expected return landscape, we observe that current opportunities are concentrated primarily in global fixed income and long dollar exposures. Within both equities and fixed income, US assets offer comparatively limited expected return relative to their global peers. A dynamic expected return portfolio applied across developed markets currently exhibits a naive expected Sharpe Ratio of approximately 1.02, supported by meaningful cross-asset breadth. This breadth allows the portfolio to assume material risk while maintaining expected compensation per unit of volatility.
So, to answer the question posed in the title of this note — Where Are the Expected Returns?
Not in the US.
Until next time.
Is this a separate portfolio or are these assumptions built into another program? Do you apply the same systems to emerging markets?