

US economic data reporting has begun to normalize after the longest government shutdown in modern history. This normalization allows us to take a comprehensive look at US economic conditions. The focus of this note will not be to provide our highest-frequency estimates of current macro data, but rather to provide our highest-fidelity assessment of the forces driving economic growth.
Our observations are as follows:
Consumer spending remains strong, driven by wage gains. However, underlying employment trends are concerning.
Business investment is entirely driven by technology investment. The degree of dispersion is likely to be unsustainable.
Government spending continues to add only minimally to overall growth and will likely continue to.
Trade continues to face sustained volatility due to tariffs. This volatility is a driver of noise, rather than macro trends.
On its current trajectory, economic growth is headed for a record year, if sustained. However, it is unlikely the current pace of growth can be sustained due to underlying weakness in employment, a likely transitory spike in exports, dispersion in consumer spending, and even greater dispersion in business fixed investment. This is reflected in our programmatic forecasts for real GDP growth, which currently project a 1-year forward rate of 2%.
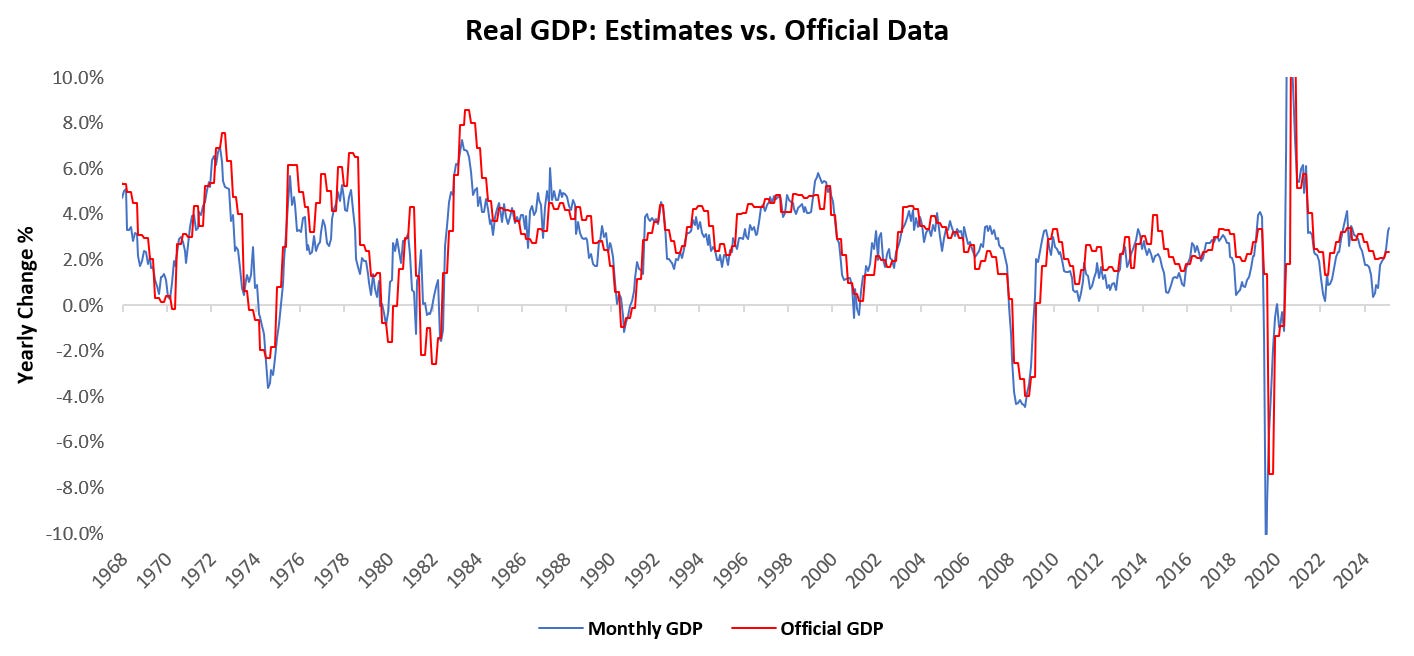
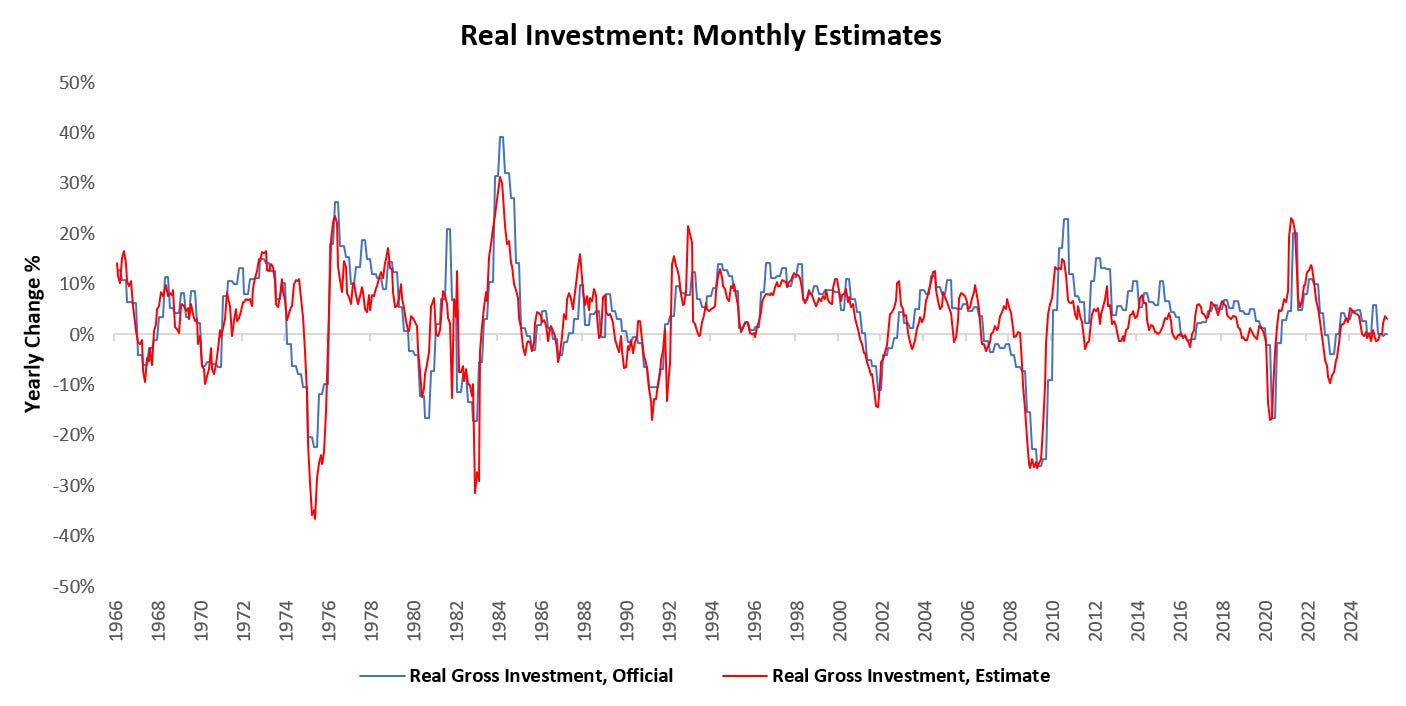
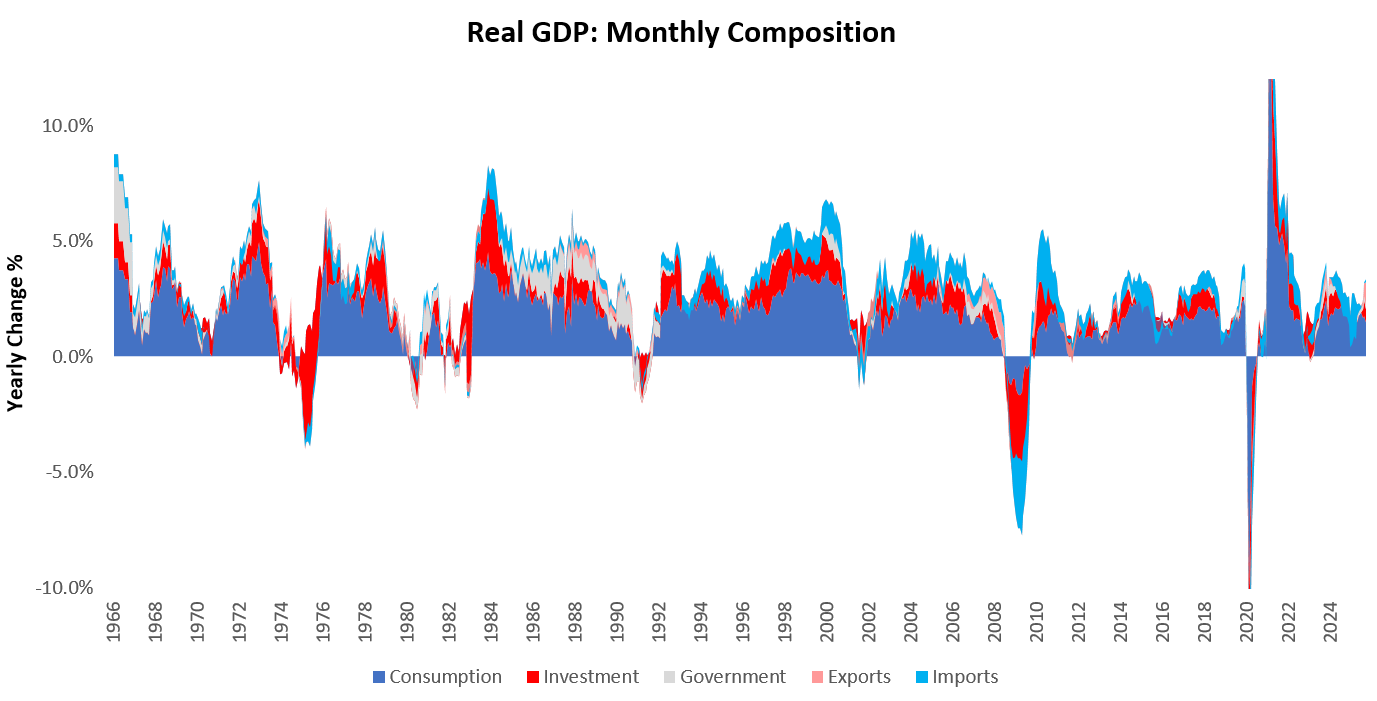
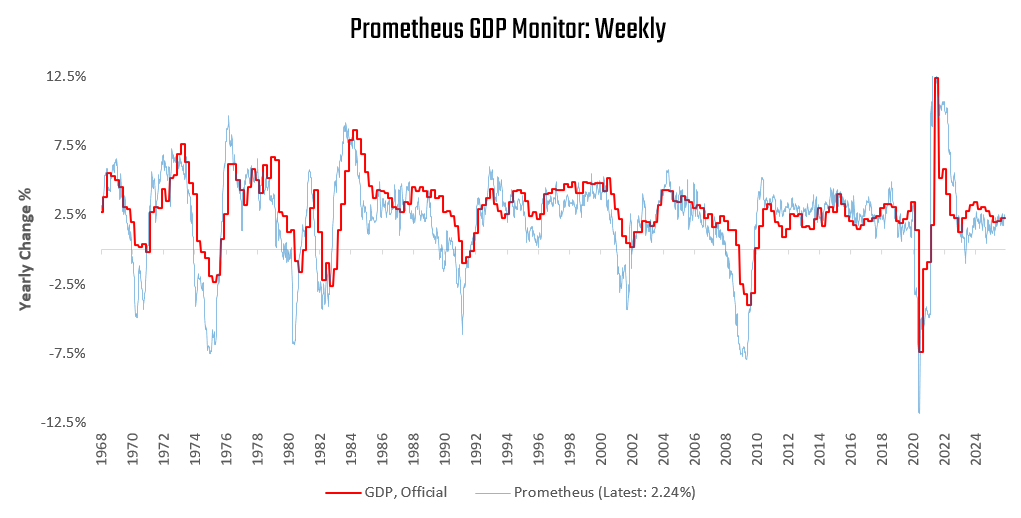
Let’s dive into the data driving this assessment. For the latest data through November, our systems place Real GDP growth at 3.37% versus one year prior. Below, we show our monthly estimates of Real GDP relative to the official data:
In November, GDP came in at 0.29% versus the prior month. Below, we show the weighted contributions to the most recent one-month change in real GDP, along with the recent history of month-on-month GDP. Additionally, we show the contribution by sector to monthly GDP in the table below:
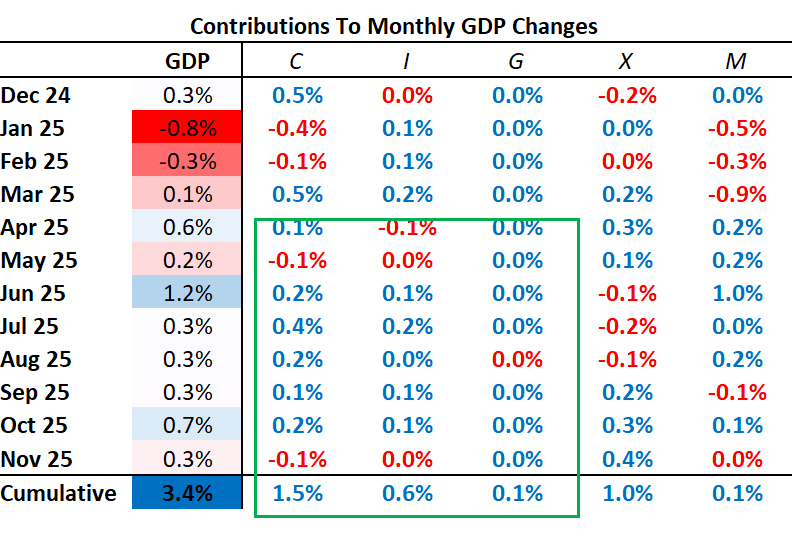
As we can see, economic growth remains positive and broad-based across sectors— though potentially overstated by export numbers. We scan through each of the major sectors, beginning with consumer spending.
The Consumer: Strong Incomes, But Meaningful Employment Headwinds
Over the last year, consumption has added 1.48% to the GDP growth of 3.37%.
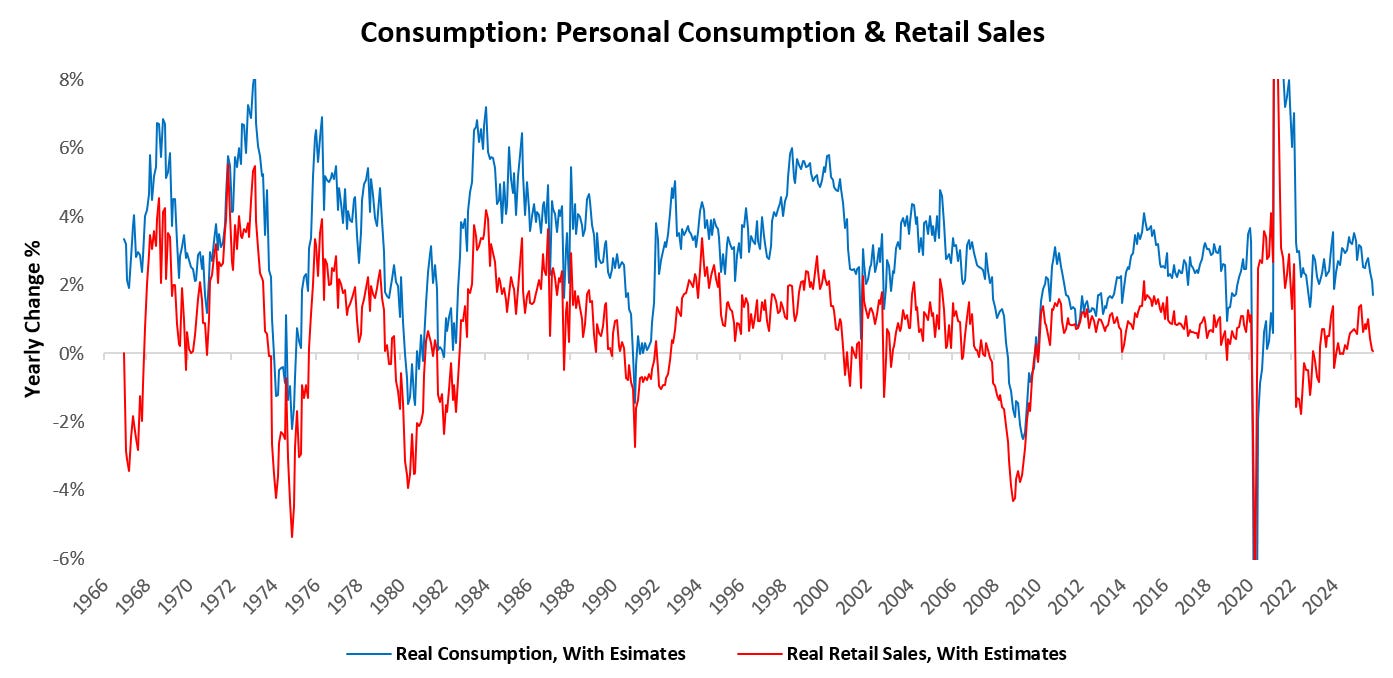
The composition of this spending has largely been skewed towards services. We visualize the major drivers below:
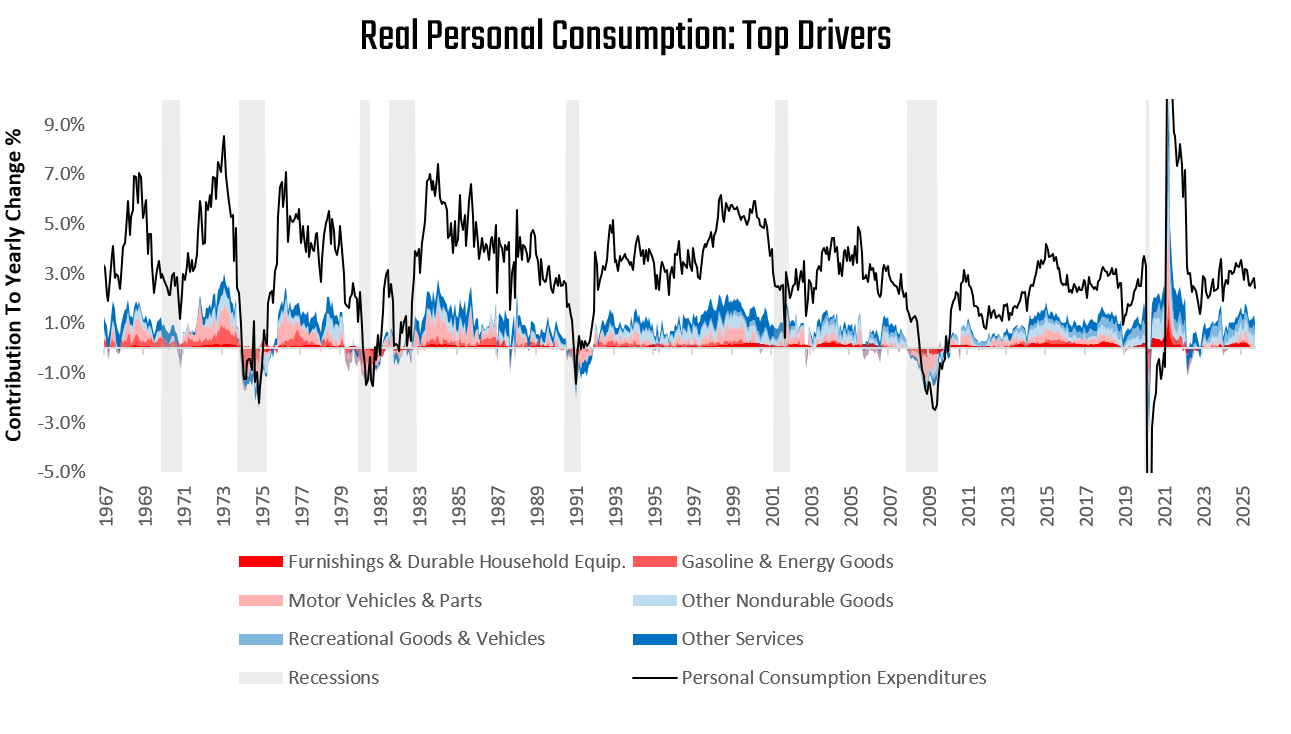
However, it is worth noting, the cyclical, leverage-sensitive spending has materially slowed:
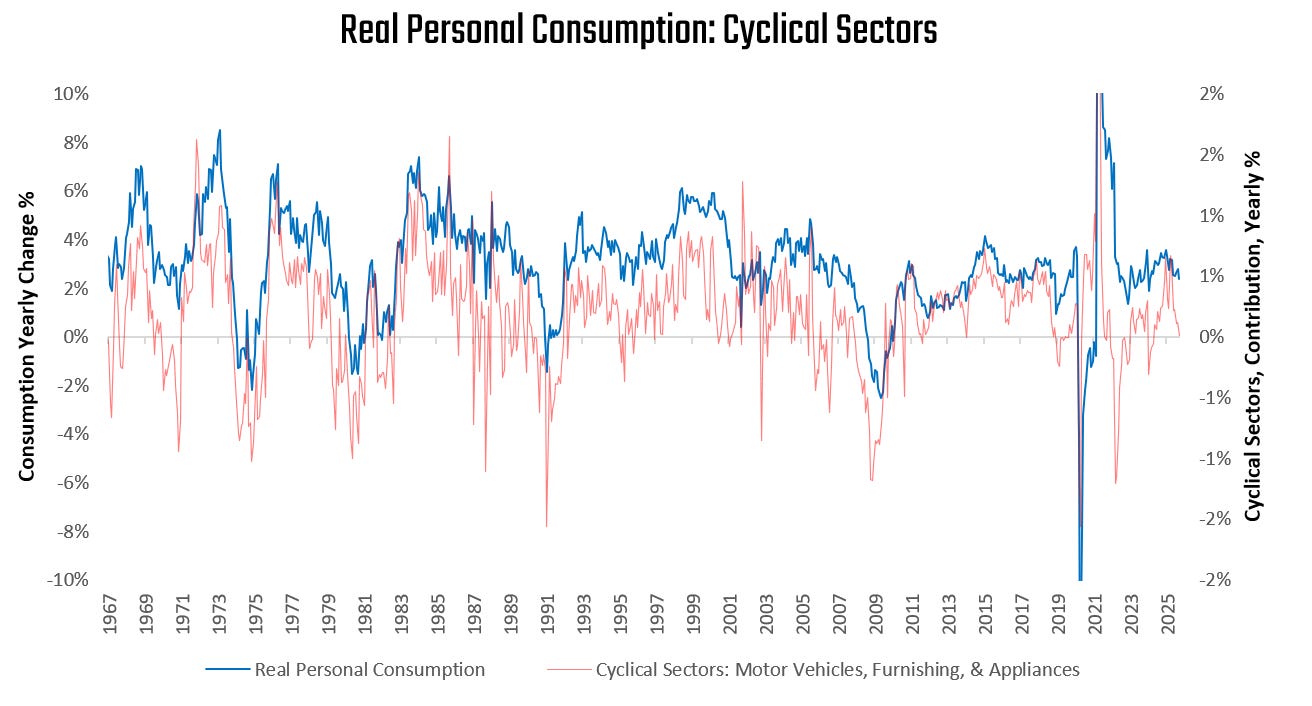
This type of weakness has typically been a prelude to recessions; however, due to compositional shifts in the economy, spending is much more financed by income than by leverage.
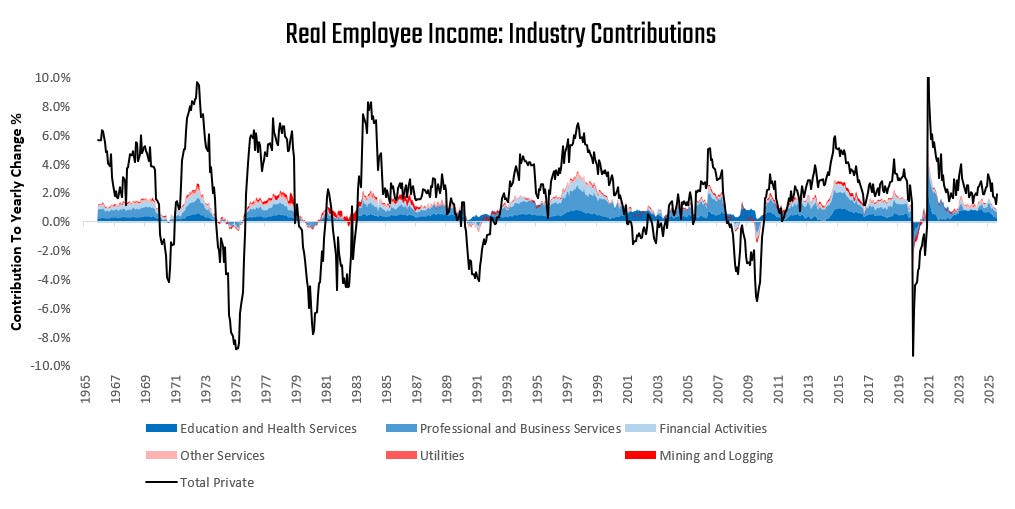
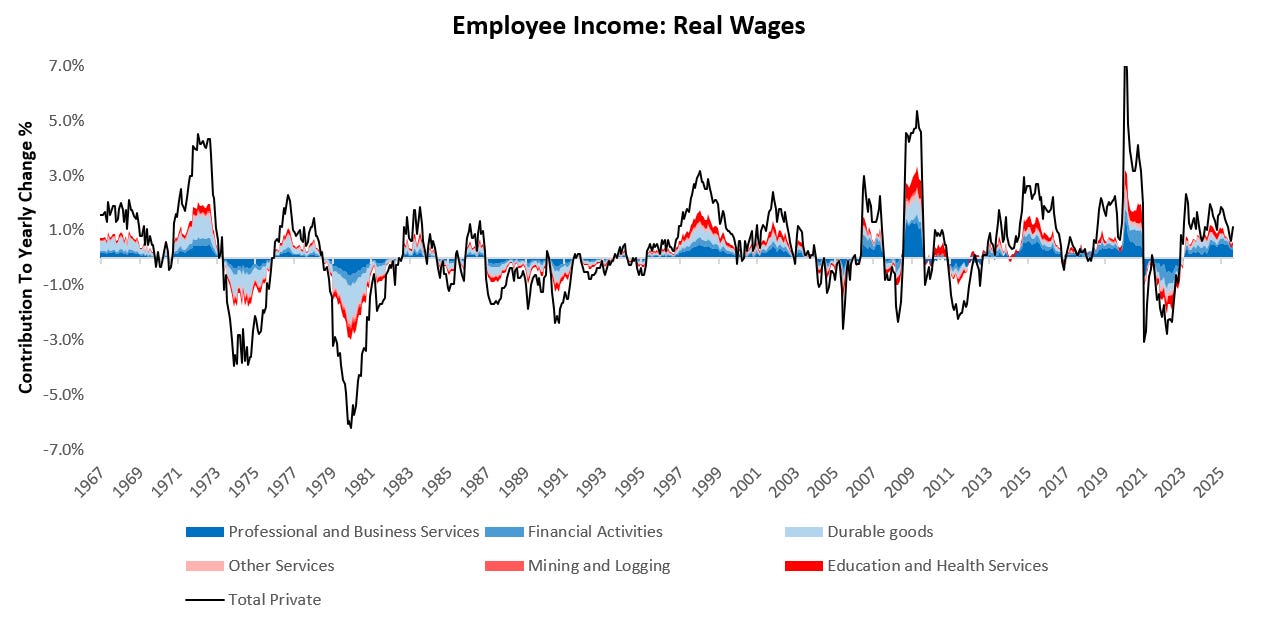
To better understand these dynamics, we turn to real employee income, which over the last year has largely been positive, with Education and Health Services, Professional and Business Services, and Financial Activities contributing strength (shown in shades of blue). On the other hand, Mining and Logging, Utilities, and Other Services are the weakest areas of income (shown in shades of red):
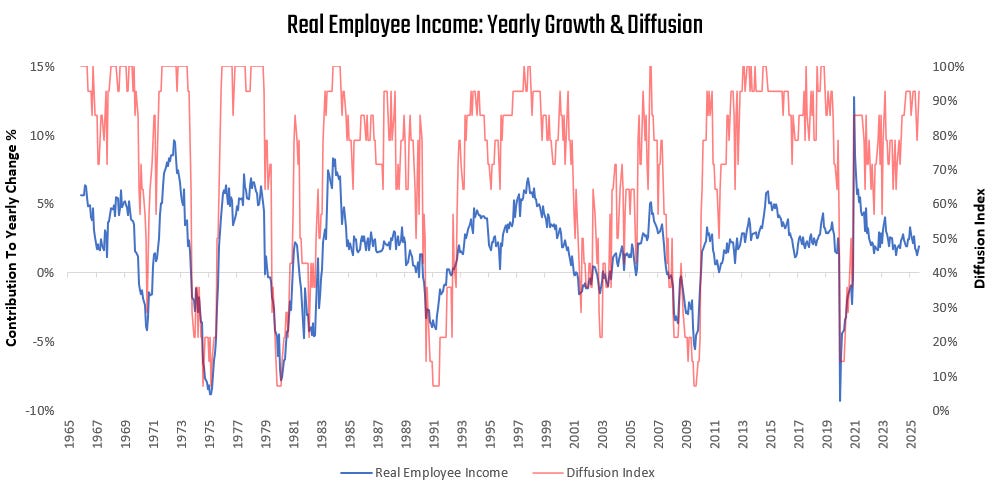
This income growth is still broad-based as well, with 90% of sectors seeing positive real growth:
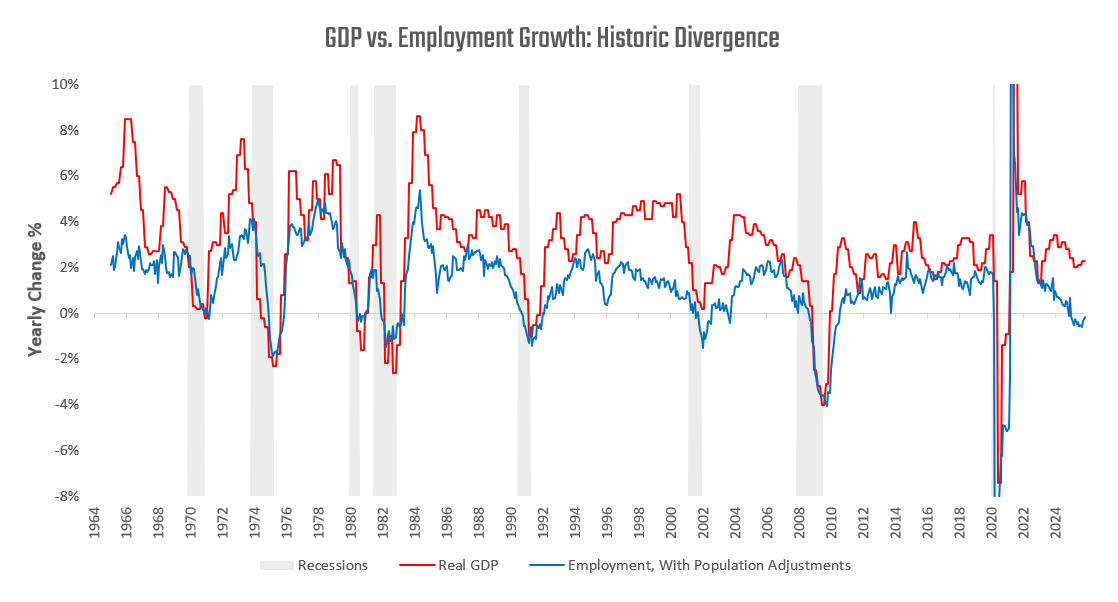
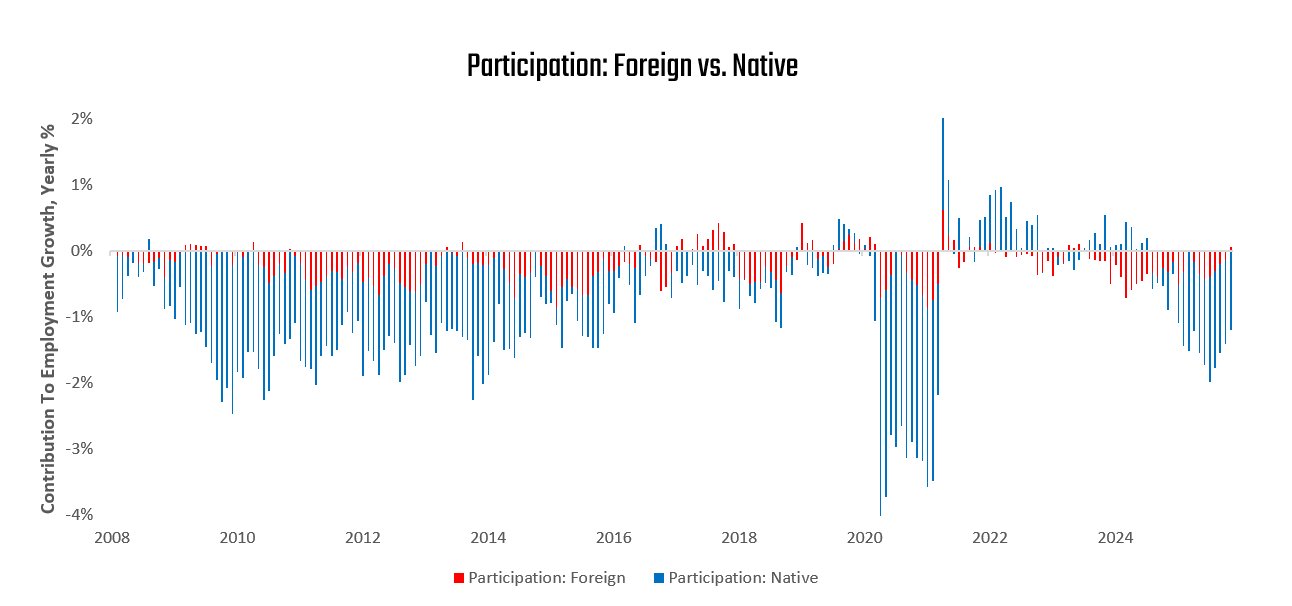
However, amid this strong income growth, we do see meaningful negative trends in underlying employment:
This weakness in employment is coming from a recomposition of the labor force to favour domestic workers over foreign, with reduced labor participation rates:
If employment is worsening/contracting, but real incomes are rising, where is the income coming from? Our estimates point to real wage growth:
Thus, scanning through the flow of income to consumer spending, we see positive income conditions flowing through to consumer spending. However, the mix of income and spending strength remains skewed to non-cyclical sectors. Furthermore, the underlying employment trend driving current income growth looks concerning, and without a meaningful shift, it will drag on overall economic activity. Overall, consumer spending remains healthy, but cannot continue to accelerate without a meaningful change to employment trends.
Investment: Technology Holds Up The Aggregates
Over the last year, investment has added 0.58% to the GDP growth of 3.37%.
While we have seen moderate dispersion in consumer spending growth, we see much larger dispersion in business investment. Most major sectors saw flat to negative growth in business investment, but the strength of business investment in information and intellectual property spending kept the aggregates afloat. We show this technology spending below:
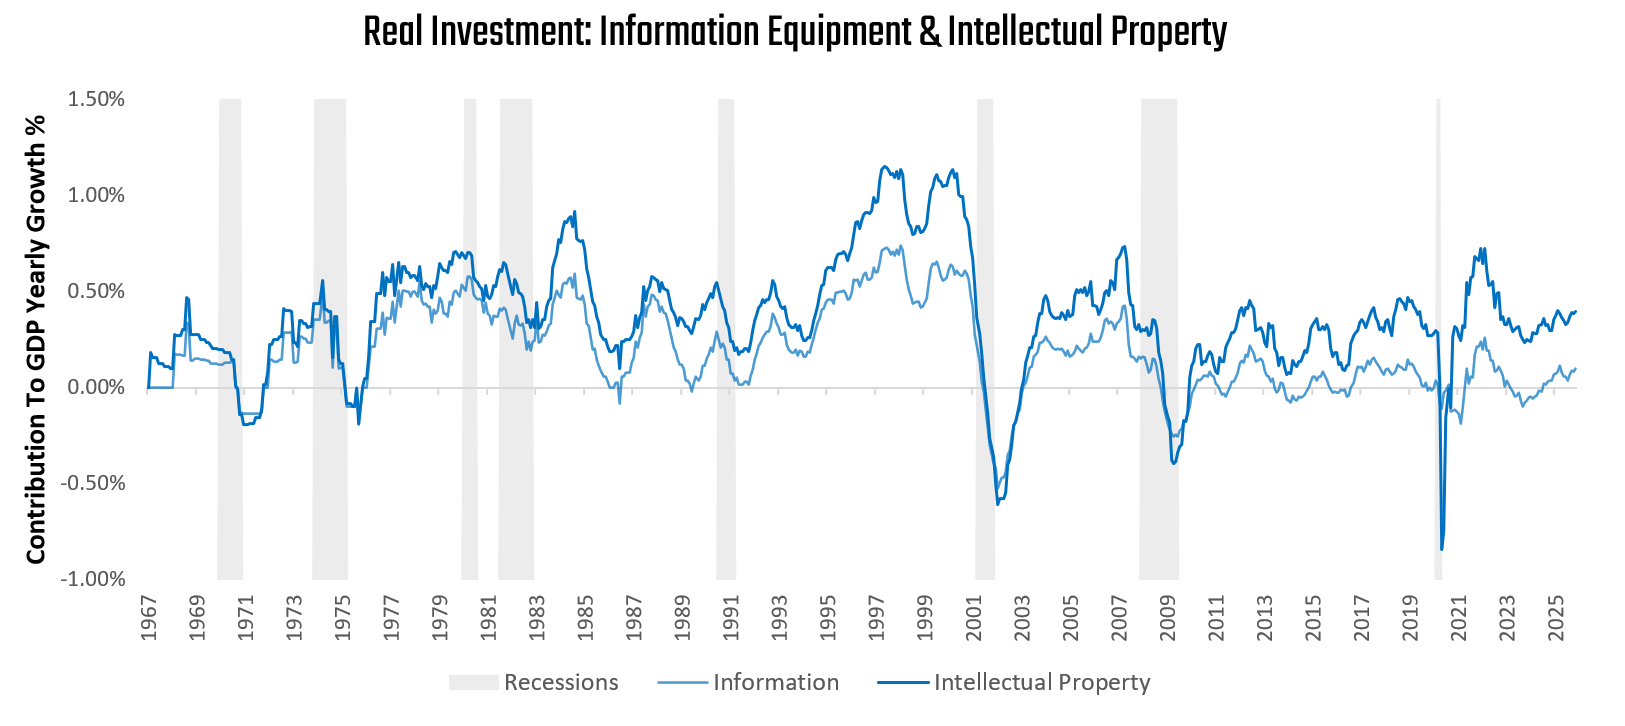
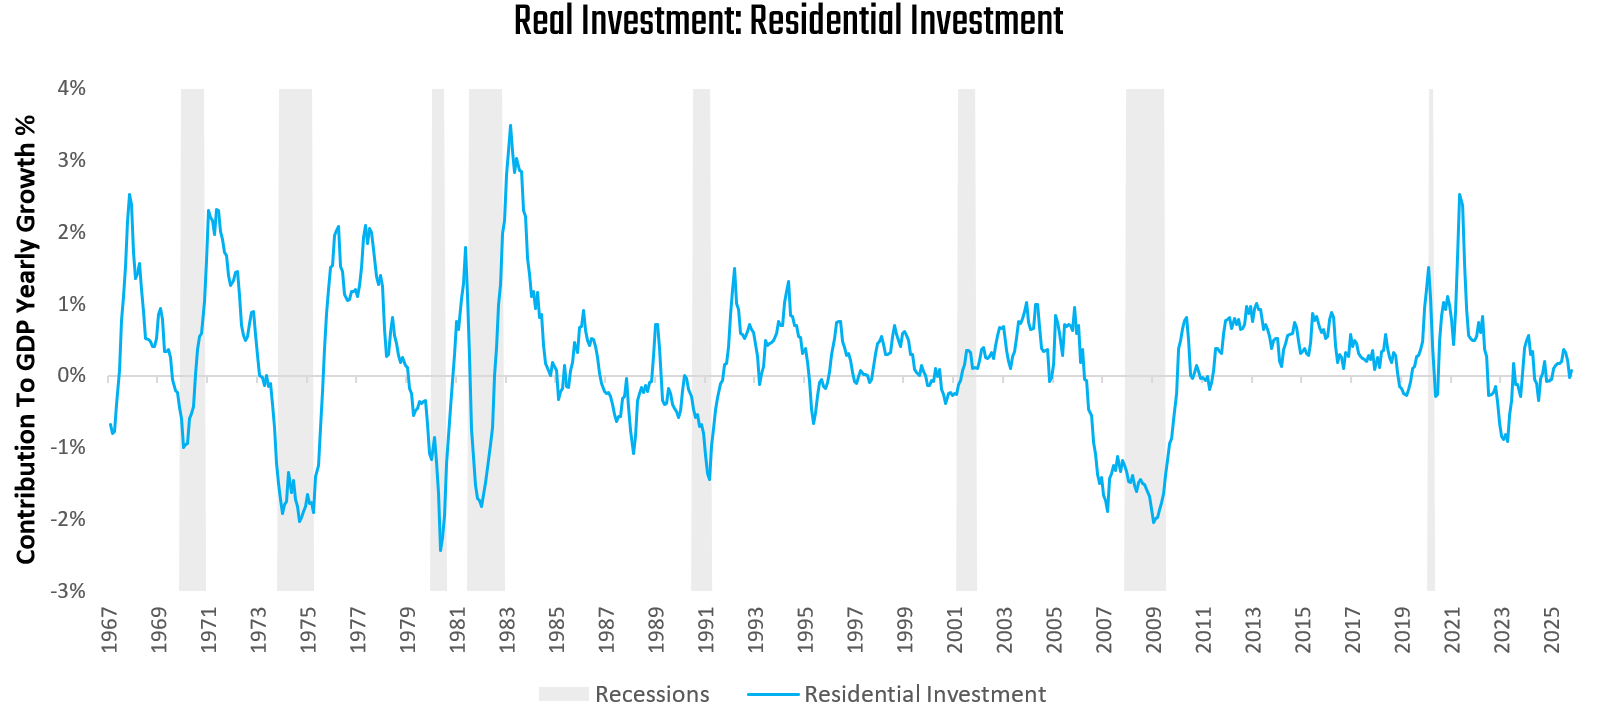
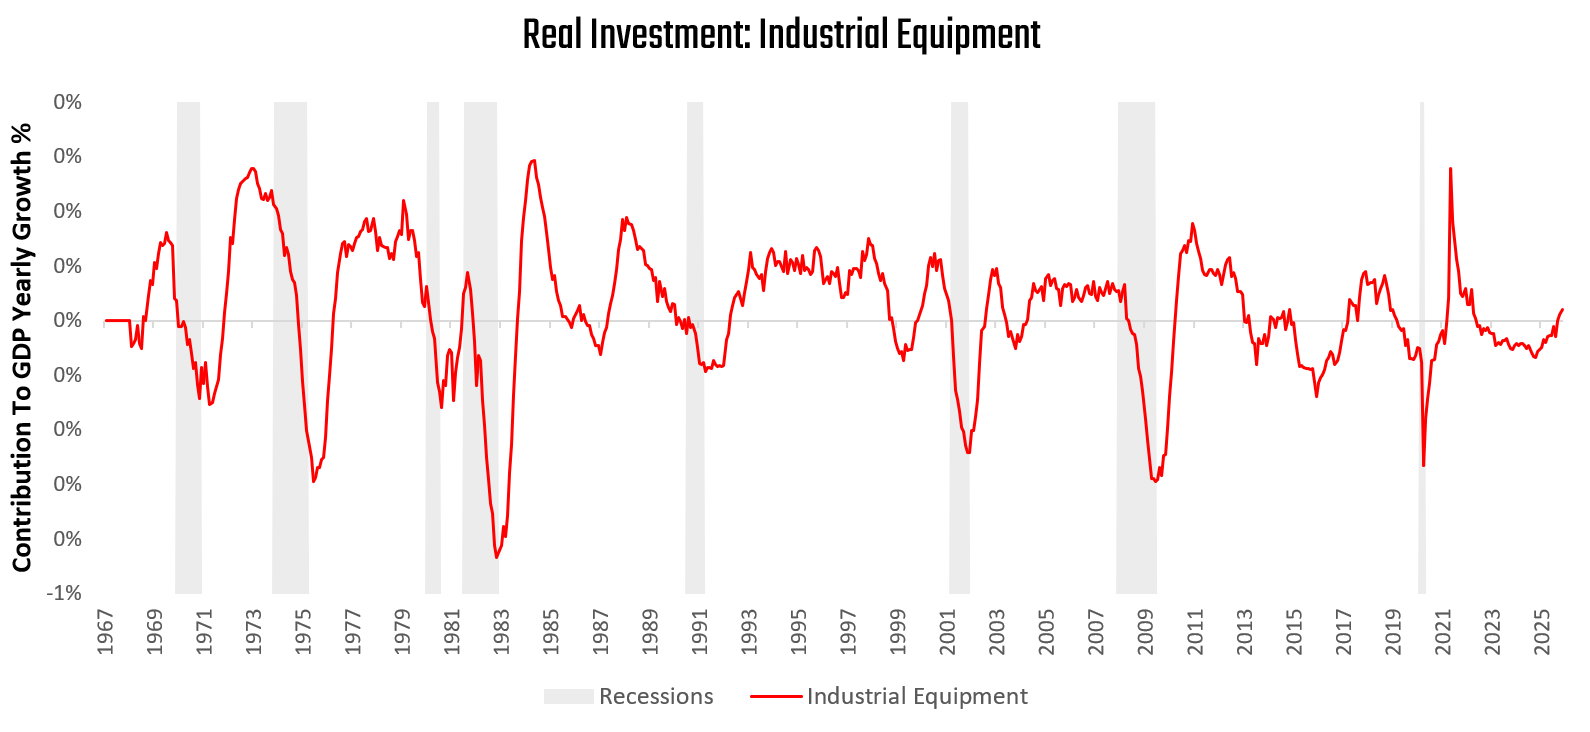
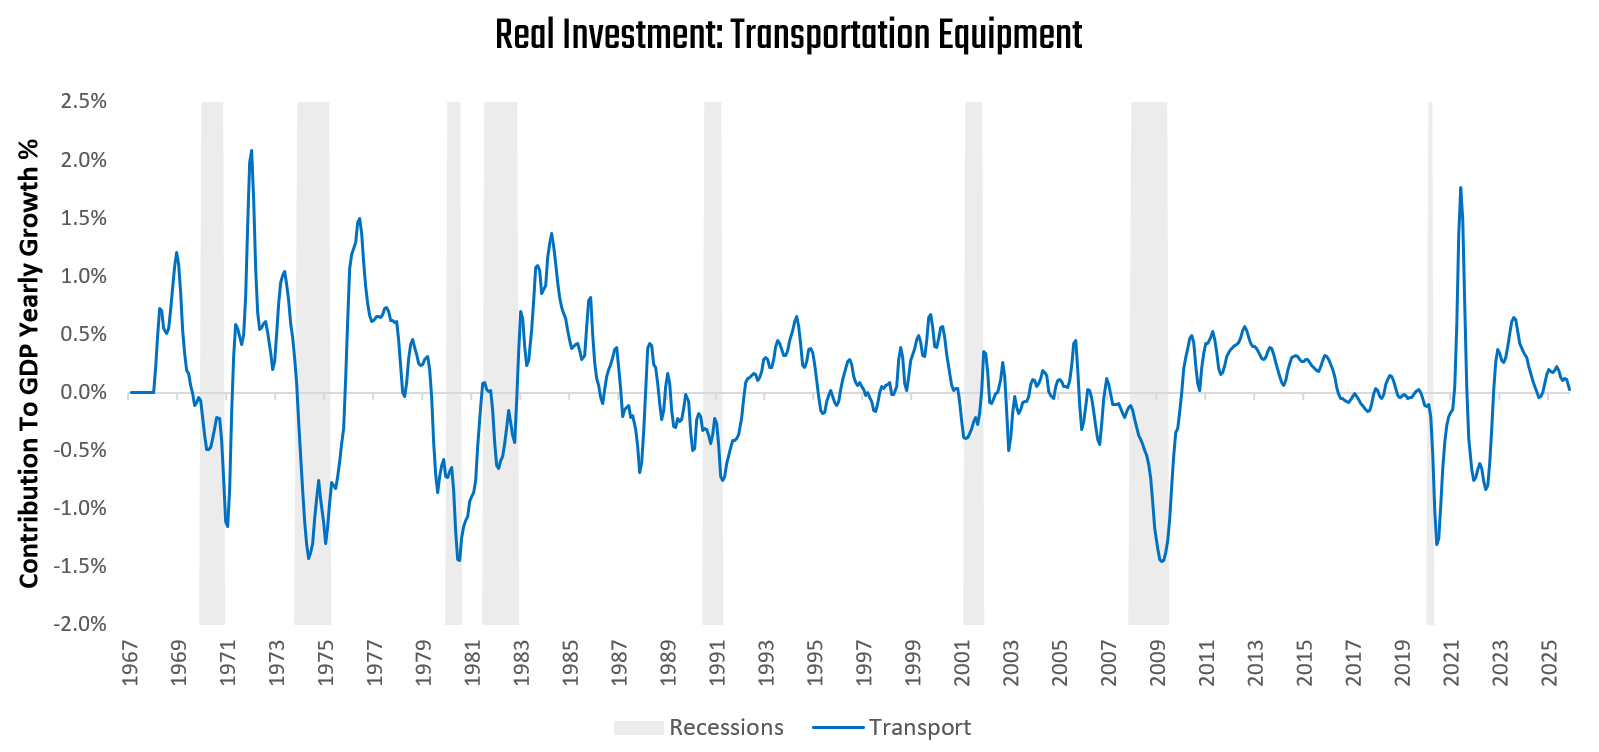
As shown, technology spending continued to power ahead, supporting aggregate investment spending. Meanwhile, residential, industrial, and transportation investments continue to show mixed to negative readings:
We see these dynamics well-reflected in equity markets, with traditional real-economy businesses lagging meaningfully behind technology firms. Given that much of this spending was financed by excess cash and continues to be, this dynamic can continue a while longer. However, as non-technology businesses become more stressed and technology companies' excess cash balances decline, this effect will likely diminish over time. Technology investment has driven almost all of the gains in business investment, but it cannot continue indefinitely.
Government Spending: Stable & Persistent
Over the last year, government spending has added 0.14% to GDP growth of 3.37%.
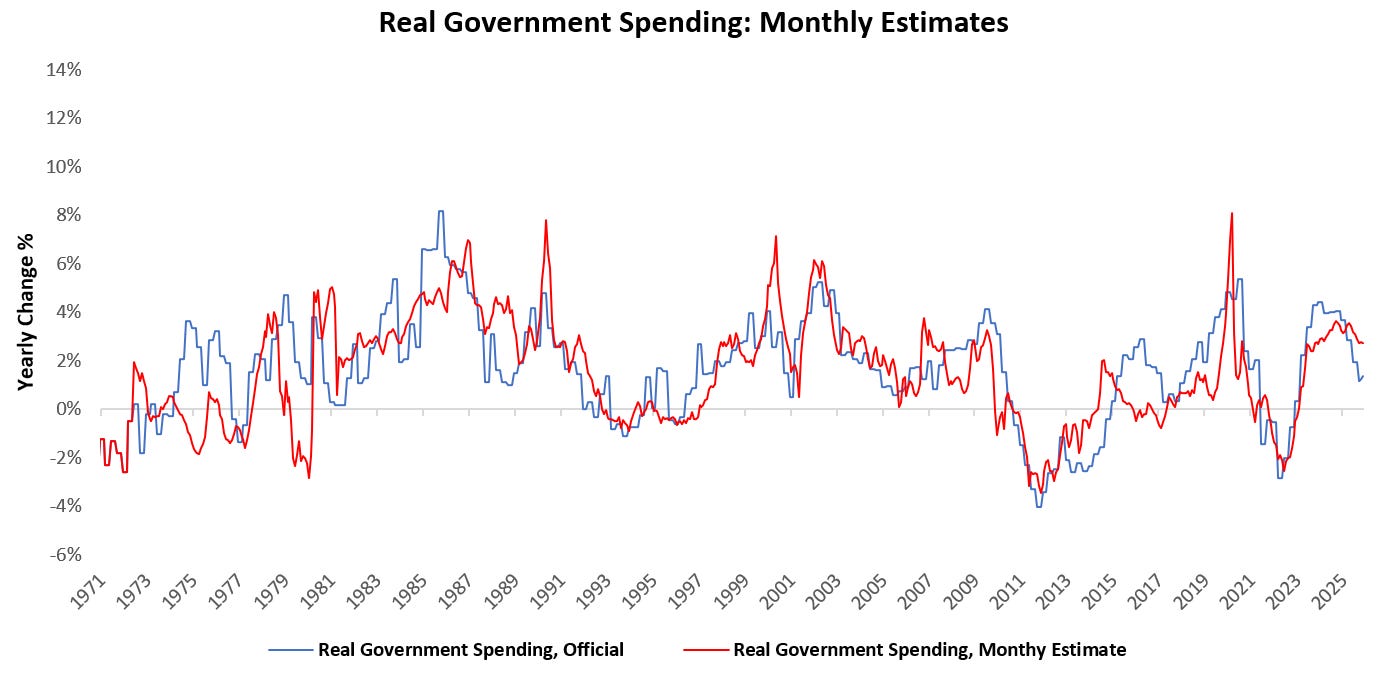
While government deficits have occupied the popular imagination, our monitors continue to show a relatively normal contribution of government spending to output and incomes. Below, we show how, after a brief rise in the post-COVID era, government wages have begun to normalize:
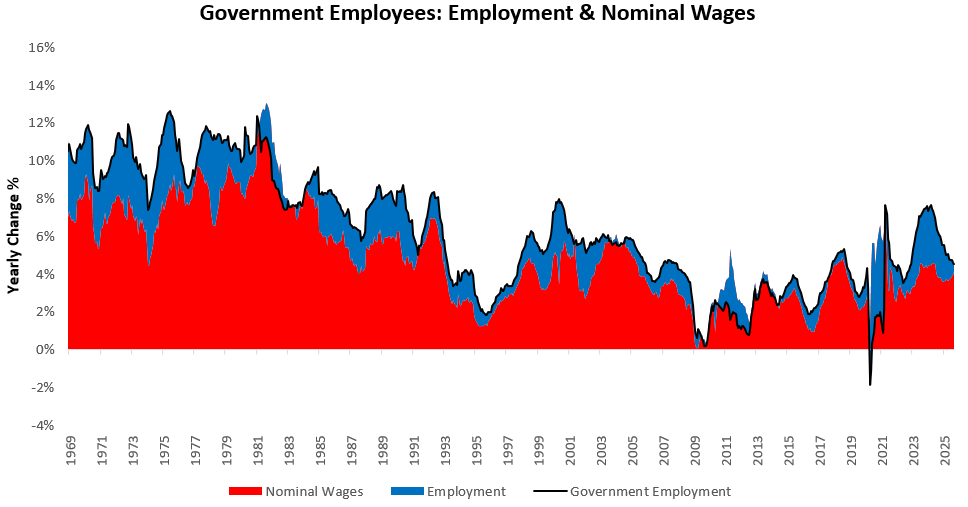
Overall, government spending remains a small part of growth and will not meaningfully move real GDP, as ever. That does not mean the government does not have a meaningful impact on macro conditions—just that it does not move growth directly and has much more significant impacts on balance sheet conditions than on growth conditions. You can read our views on the same here:
Is It Time For Bonds To Recover?

This note is one typically reserved for clients of Prometheus Institutional. Occasionally, we share notes from our Prometheus Institutional to augment our retail offering here on Substack. If you are interested in access to our institutional work, you can click this link:
Overall, government spending will likely remain a support to growth but not a determinant of shifts in the economic cycle.
Trade: Tariff-Induced Volatility
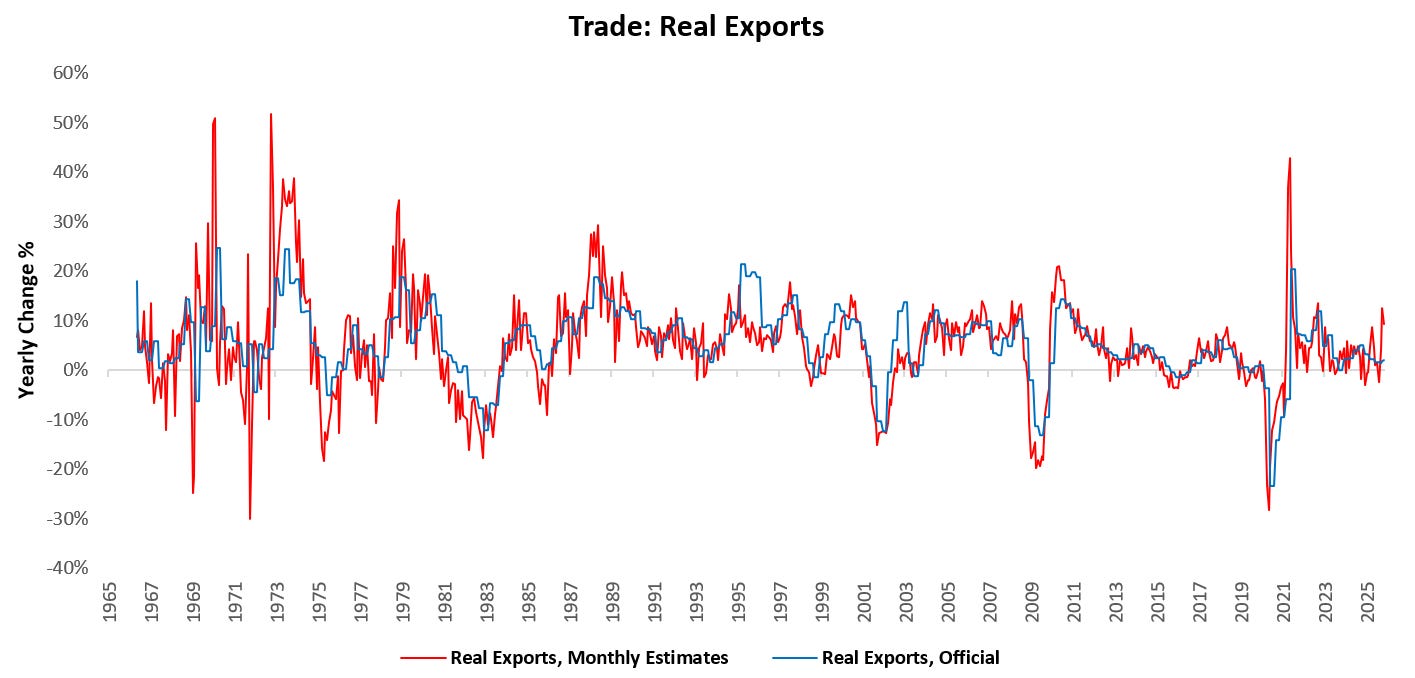
Much like government spending, trade is rarely the driver of shifts in the US macroeconomic cycle, as the US is largely a domestically oriented economy. This year, however, we have seen significant volatility in trade data, mostly induced by tariff policy expectations. Regardless of the concerns, trade has been a minimal driver of trend rates of growth.
Over the last year, exports have added 0.99% to the GDP growth of 3.37%.
Meanwhile, imports have added 0.14% to GDP growth:
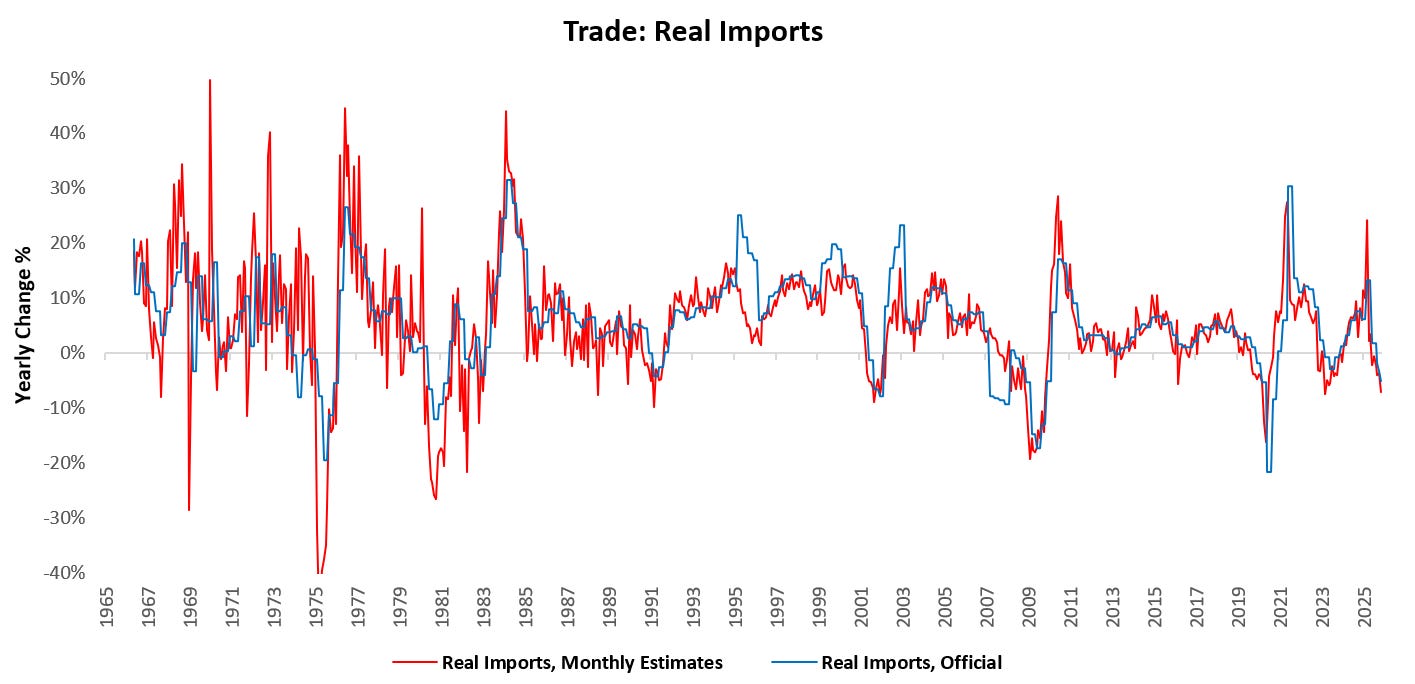
We have seen some impacts of tariffs on import volumes; however, these effects have not been felt by consumers or the broader economy and are unlikely to cause a material shift to the outlook. For our full views on the mechanical effects of tariffs, you can read the note below:
What Is The Worst Case Impact Of Tariffs?

The best information we can ever provide investors is the mechanics of how we think about macro conditions over time, rather than what we think about them at any particular time.
Real GDP: Adding It All Up
We show the cumulative contributions of various sectors to the total topline yearly real GDP growth:
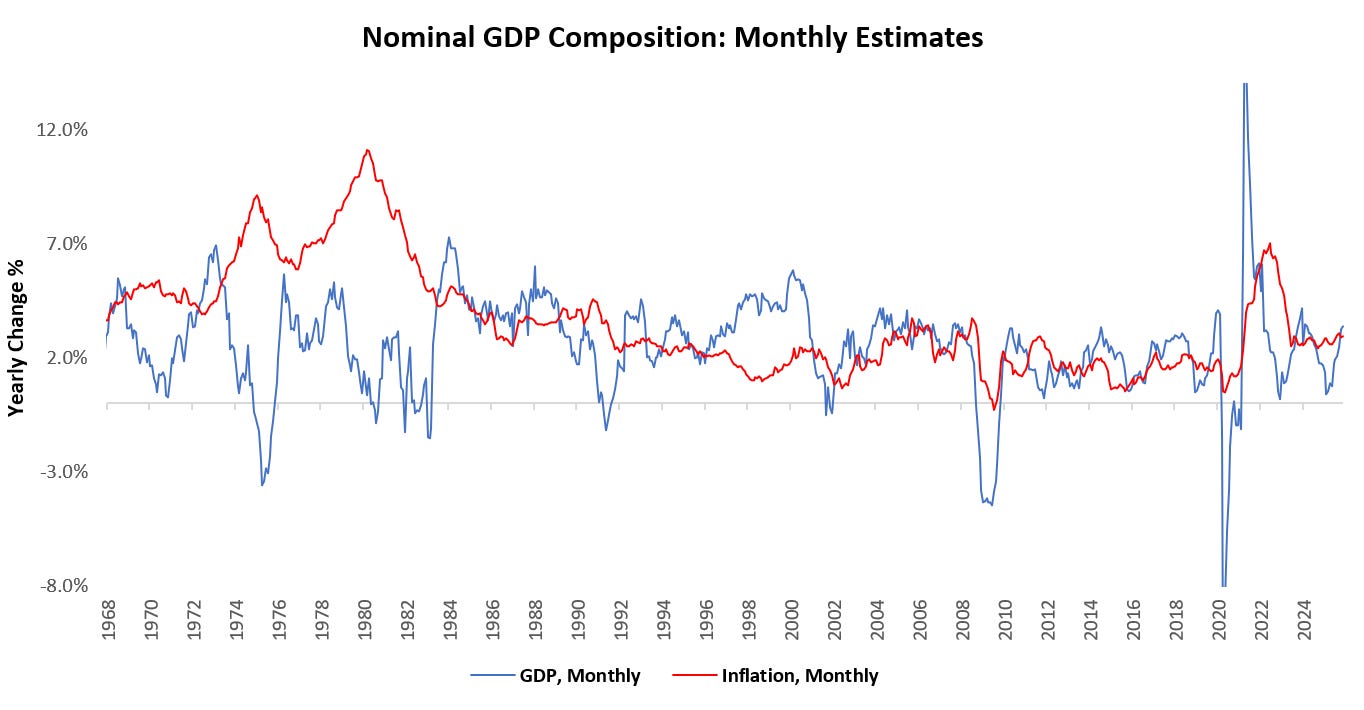
Additionally, we show the composition of the monthly estimates of nominal GDP, broken into real GDP growth and inflation. Our latest estimates place nominal GDP at 6.29% versus one year prior, with real GDP growth of 3.37% and inflation of 2.92%:
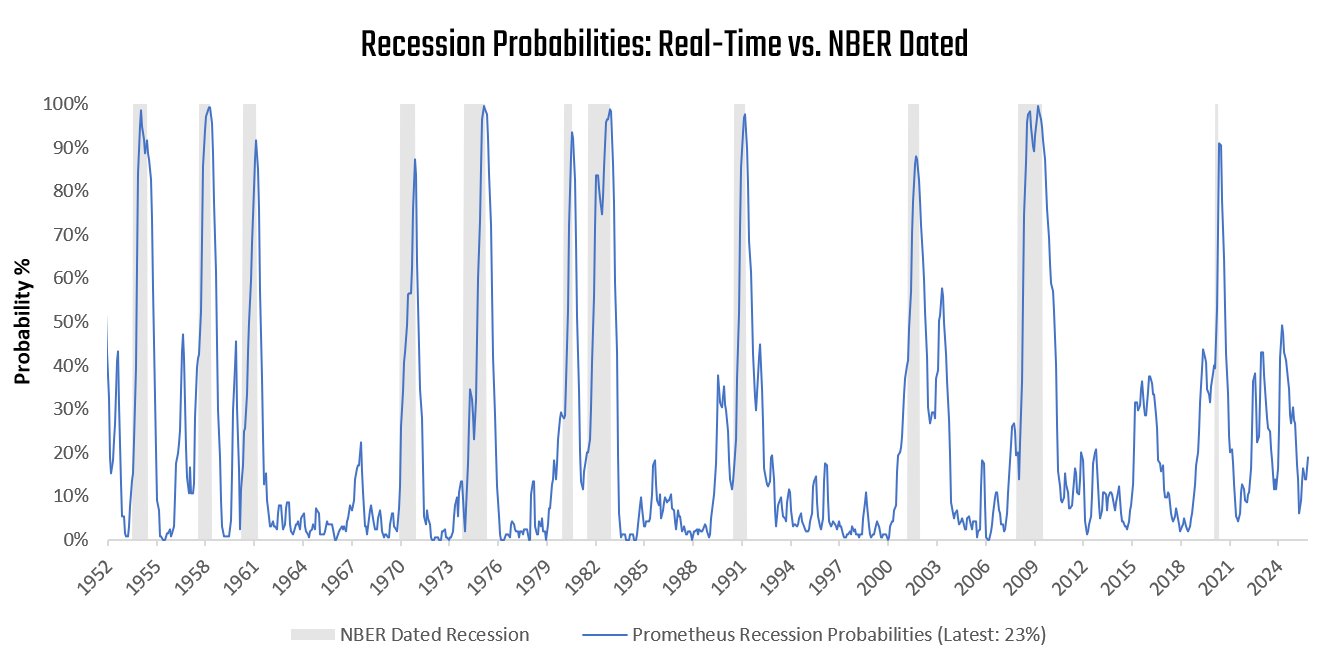
To further assess whether GDP conditions are consistent with recessionary pressures, we aggregate macroeconomic indicators, in line with the NBER's recession classification methodology, into a recession probability monitor. This gauge gives us a real-time understanding of developing recessionary pressures. Currently, recession probabilities are at 23%:
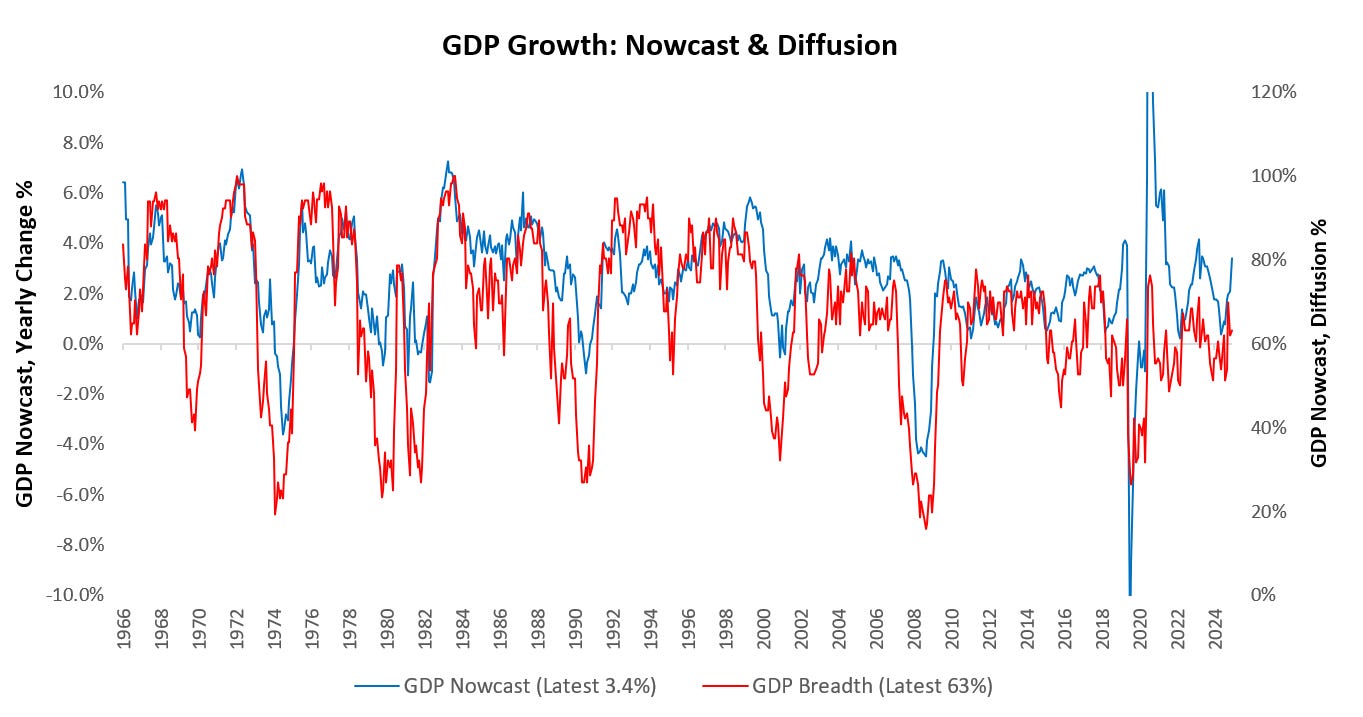
Next, we zoom out to offer what the mosaic of economic data says about the pervasiveness of GDP growth. Our GDP Nowcast uses 75 measures of real growth conditions to provide timely insights into the economy. We share both the current level of the nowcast in blue and a diffusion index of the underlying components in red. Currently, 63% of subcomponents are rising, consistent with an expansion:
Our latest weekly reads of real GDP suggest a similar picture for the pace of GDP growth, albeit a little lower than our monthly readings:
Below, we visualize the prospective paths of real GDP growth over the next twelve months using our data trajectory monitor. We share two processes. First, we extrapolate the current trend in the data to visualize the prospective trajectory of GDP based on the current trend. Additionally, we share our forward-looking estimates for real GDP growth based on our proprietary process:
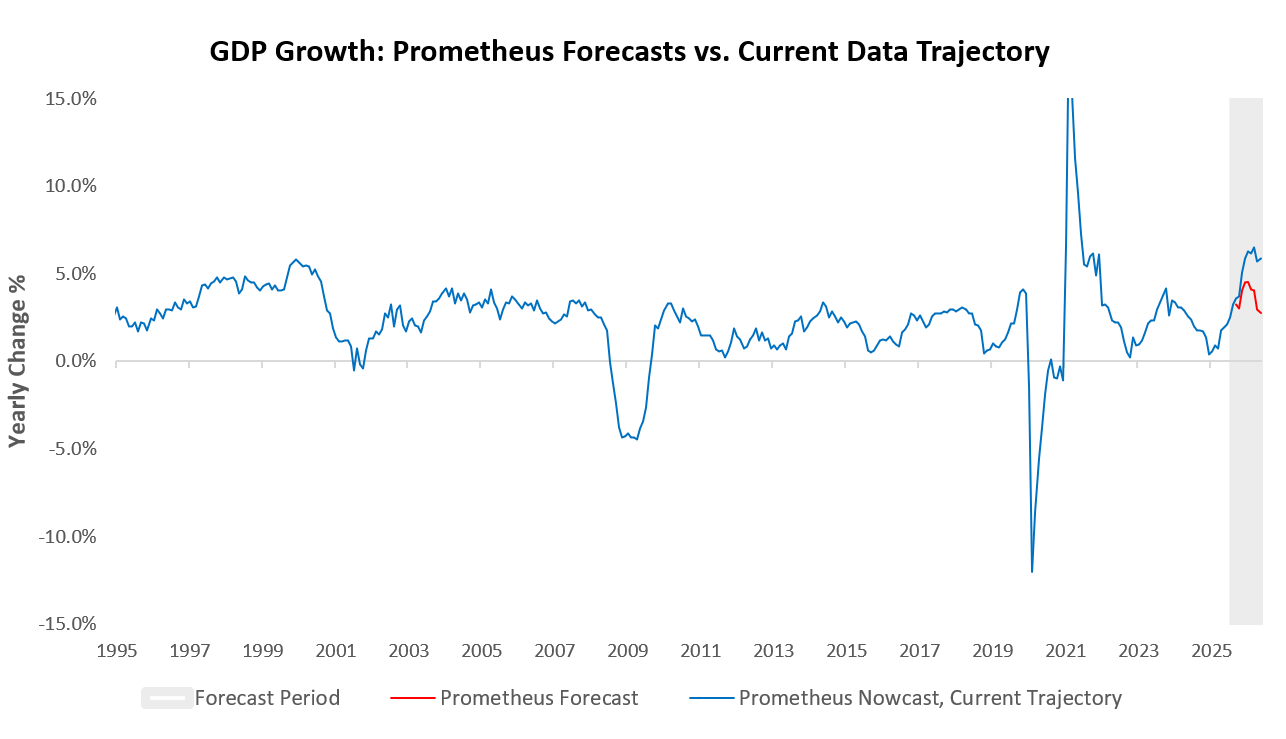
On its current trajectory, economic growth is headed for a record year, if sustained. However, it is unlikely the current pace of growth can be sustained due to underlying weakness in employment, a likely transitory spike in exports, dispersion in consumer spending, and even greater dispersion in business fixed investment. This is reflected in our programmatic forecasts for real GDP growth, which currently project a 1-year forward rate of 2%.
The future is dynamic, and our systems will adapt as the data evolves. We will keep you updated as the outlook shifts. Until next time.
Terrific summary of all the drivers. Great nowcast too!