

We scan through the latest CPI data to understand its implications for markets.
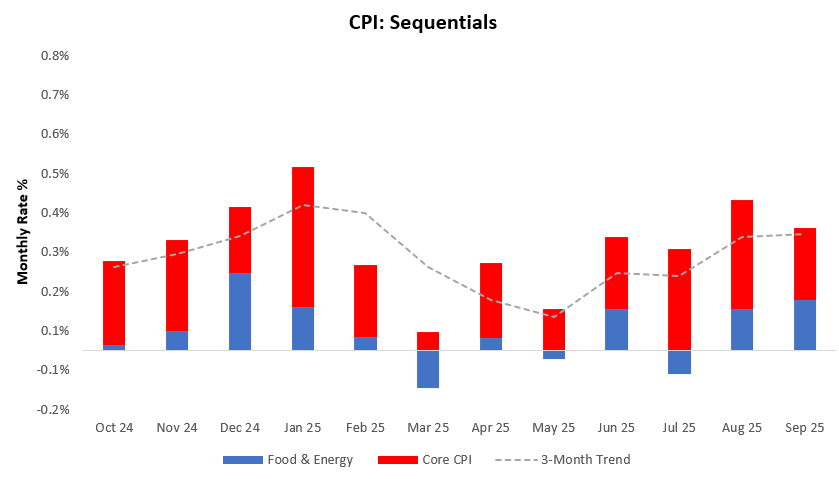
In September, headline CPI came in at 0.31% disappointing consensus expectations of 0.4%. Core CPI contributed 0.18% to this print, with food & energy contributing the remaining 0.13%. This print drove an acceleration in the three-month trend. Below, we display the sequential evolution of the data:
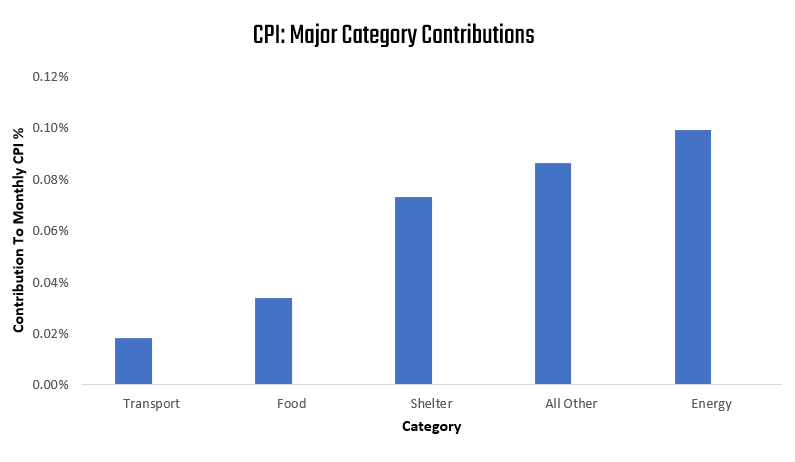
The primary drivers of CPI inflation are food, energy, transport, and shelter. These components have contributed 0.03% (Food), 0.1% (Energy), 0.02% (Transport), and 0.07% (Shelter), respectively. We display these contributions to the 0.31% change in CPI below:
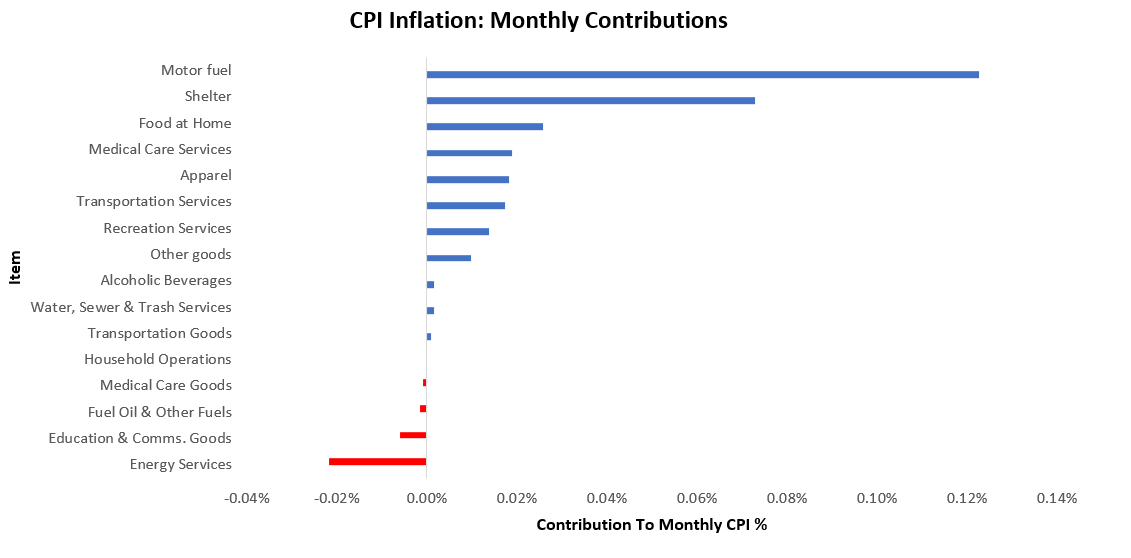
Inflation was largely positive, with Motor fuel contributing most positively, and Energy Services contributing most to weakness. We display the largest movers to the upside and downside below:
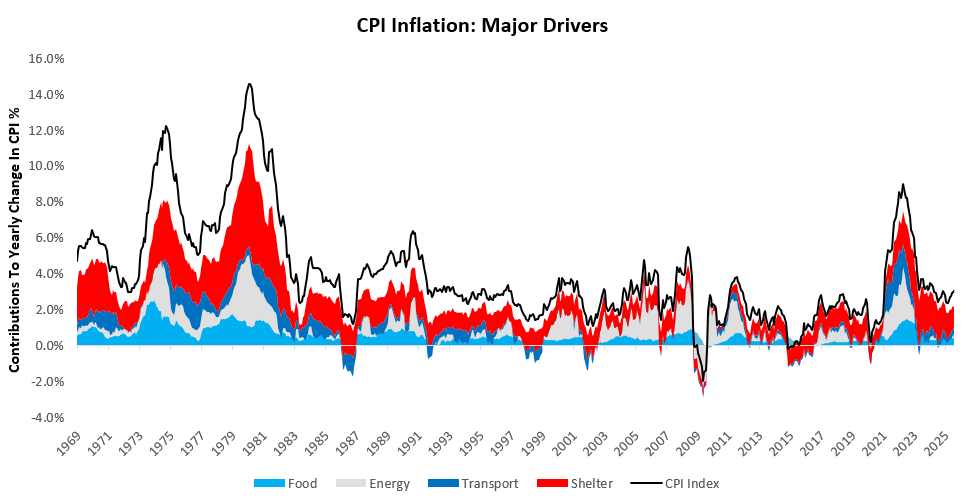
For further perspective, we show how these areas have accounted for the majority of variation in inflation both economically and statistically. Over the last year, food, energy, transport, and housing have contributed 0.42% (Food), 0.2% (Energy), 0.32% (Transport), and 1.26% (Shelter), respectively, to the change in inflation. We display these principal drivers of inflation over time below:
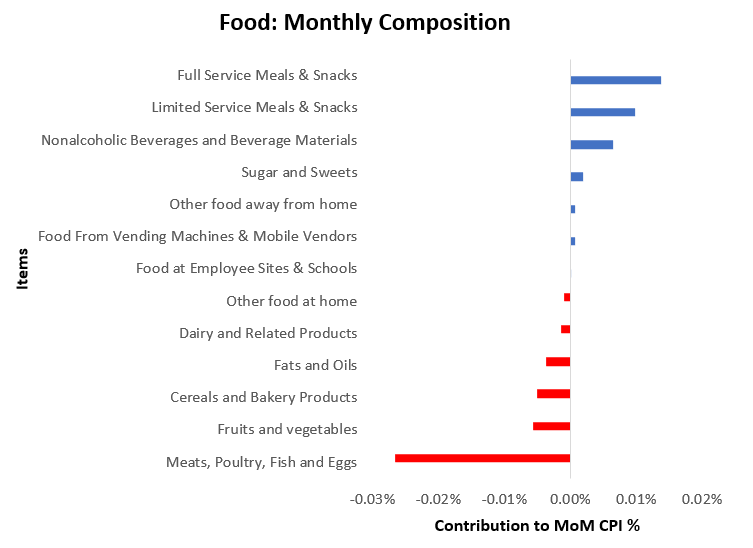
We now zoom into our major categories of food, energy, transport, and shelter. We begin with food. The most recent data showed food inflation was somewhat mixed, with Full Service Meals & Snacks showing the most relative strength and Meats, Poultry, Fish, and Eggs showing the most weakness:
For further perspective, we also show the evolution of food inflation over the last year with the strongest contributors in shades of blue ( Meats, Poultry, Fish and Eggs, Full Service Meals & Snacks, Limited Service Meals & Snacks) and the weakest in shades of red (Fruits and vegetables, Fats and Oils, Cereals and Bakery Products):
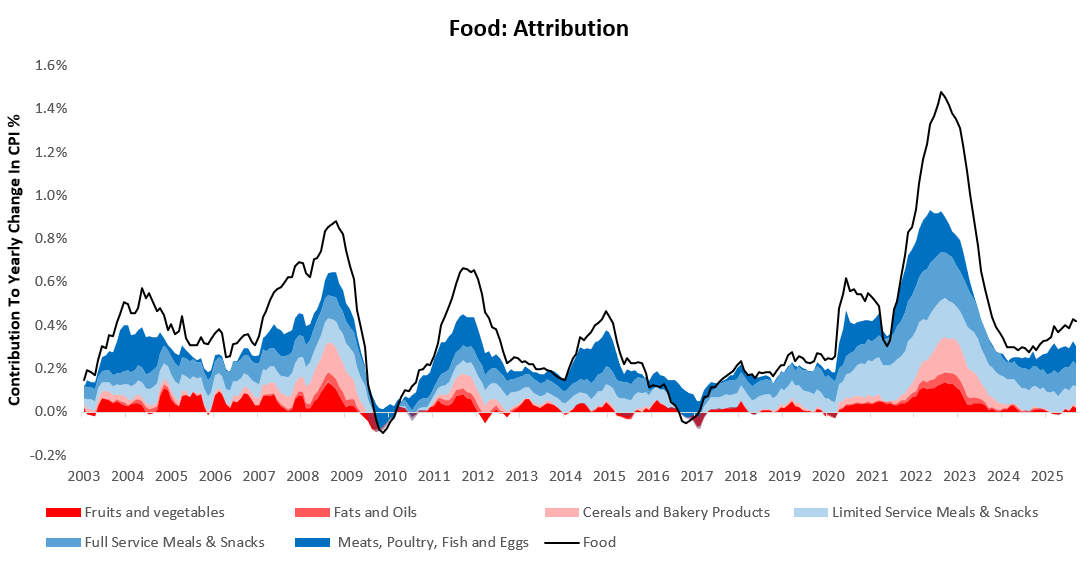
Food inflation continues to drive aggregate inflation higher.
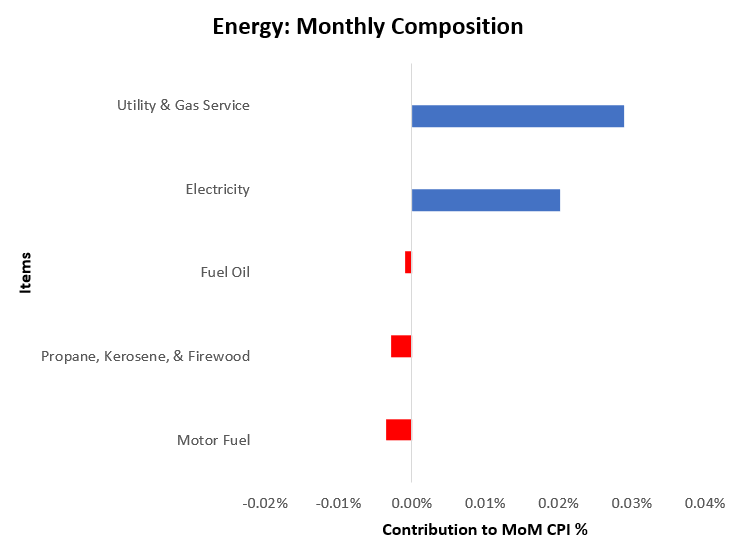
Next, we turn to energy. The most recent data showed energy inflation was largely negative, with Utility & Gas Service showing the greatest relative strength and Motor Fuel the greatest weakness.
We also show the contributions of these items to total energy inflation over the last year with historical context:
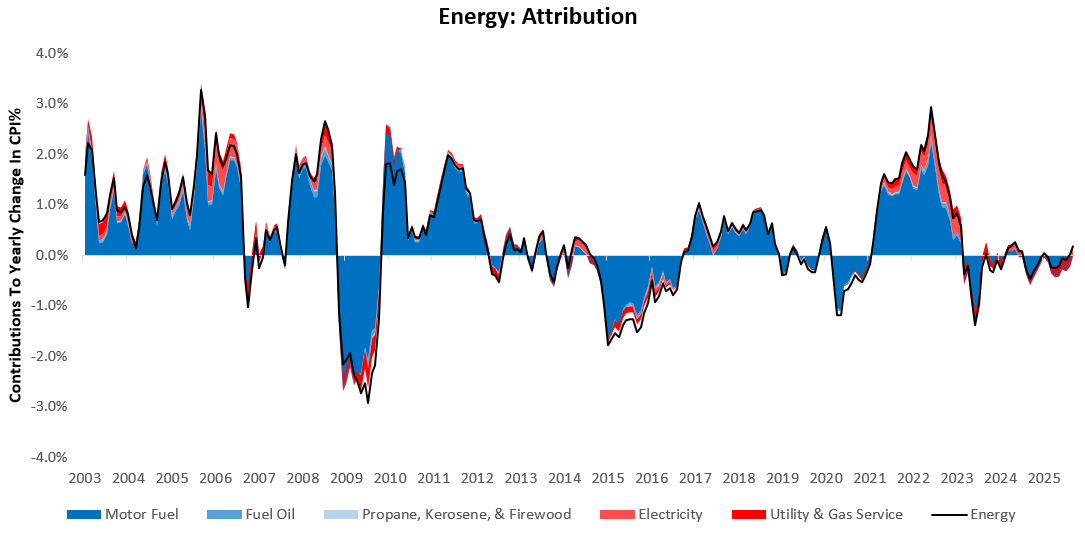
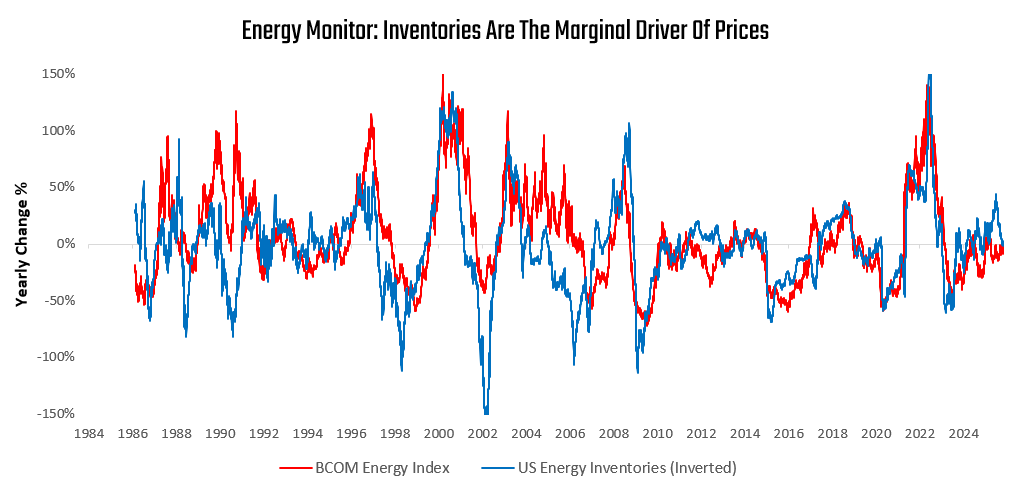
Energy prices have turned upwards, now a positive contributor to headline CPI after being neutral for an extended period.
We now turn to transportation. The most recent data showed transport inflation was somewhat mixed, with Public Transportation showing the most relative strength and Used Vehicles showing the most weakness.
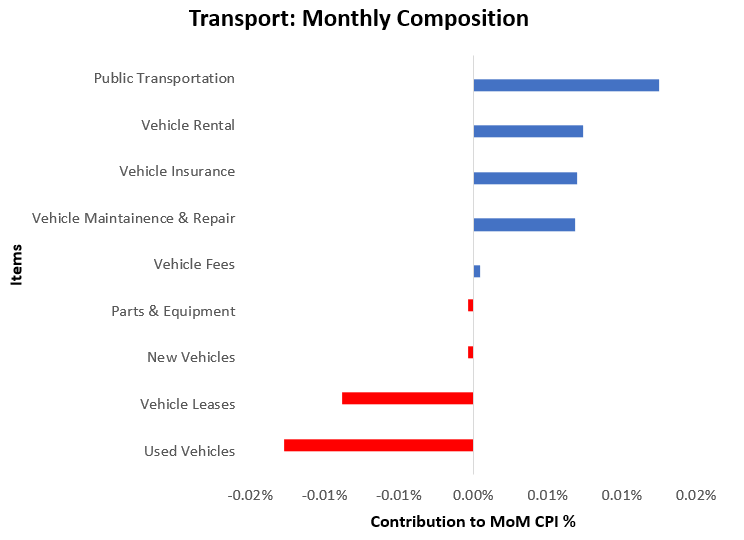
For further perspective, we also show the evolution of transportation inflation over the last year with the strongest contributors in shades of blue (Vehicle Insurance, Vehicle Maintenance & Repair, Used Vehicles) and the weakest in shades of red (Public Transportation, Vehicle Leases, Vehicle Rental):
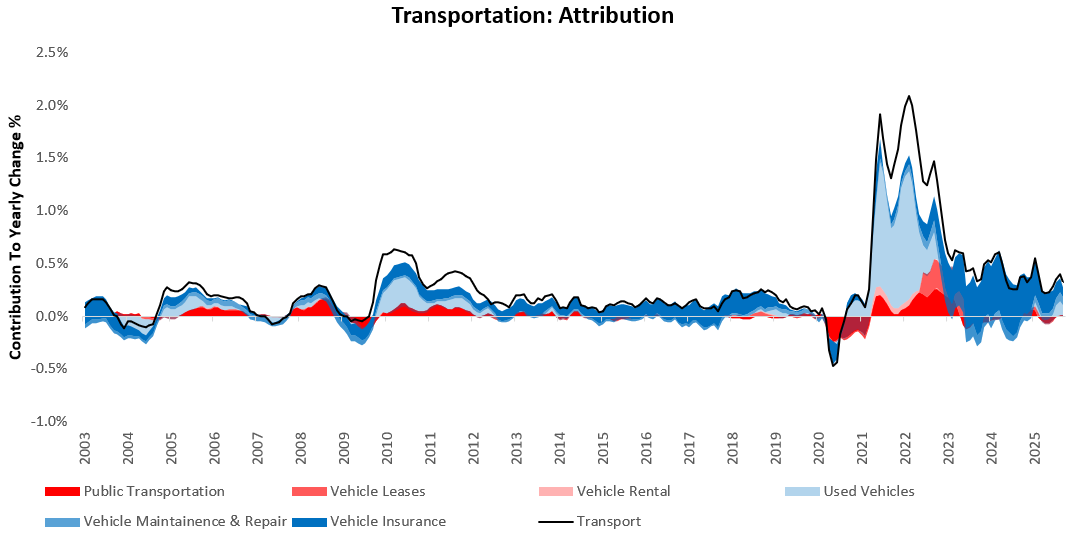
Transportation remains a stable and consistent contributor to elevated inflation, as we have expected for several years.
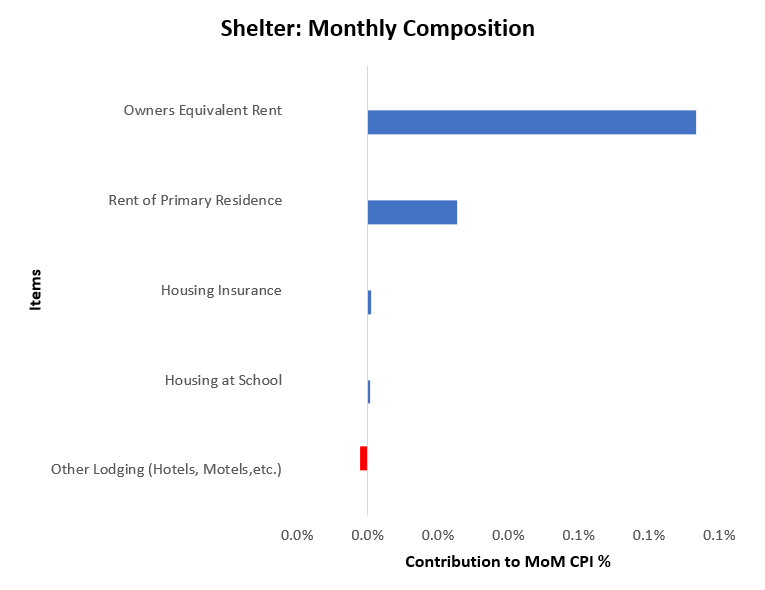
Finally, we examine shelter, which is the most significant driver of consumer inflation in the economy. The most recent data showed shelter inflation was largely positive, with Owners Equivalent Rent showing the greatest relative strength and Other Lodging (Hotels, Motels, etc.) showing the greatest relative weakness.
We also show the contributions of these items to total shelter inflation over the last year with historical context:
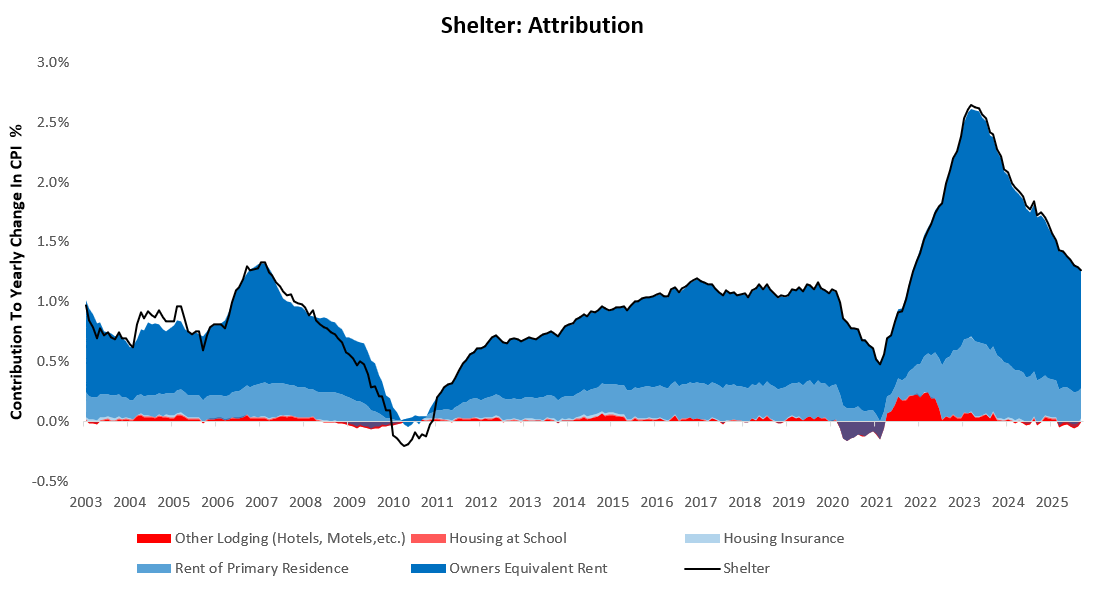
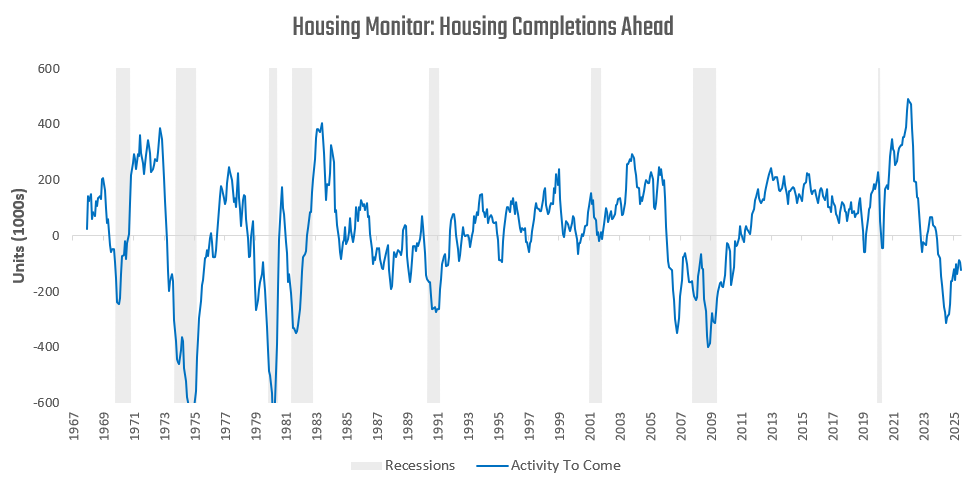
Shelter continues to drive the majority of inflationary trends and remains in a downtrend, consistent with housing activity.
Looking ahead:
Housing inflation will likely remain under pressure as housing demand remains weak.
Energy prices will likely remain neutral as inventory dynamics continue to put downward pressure on prices.
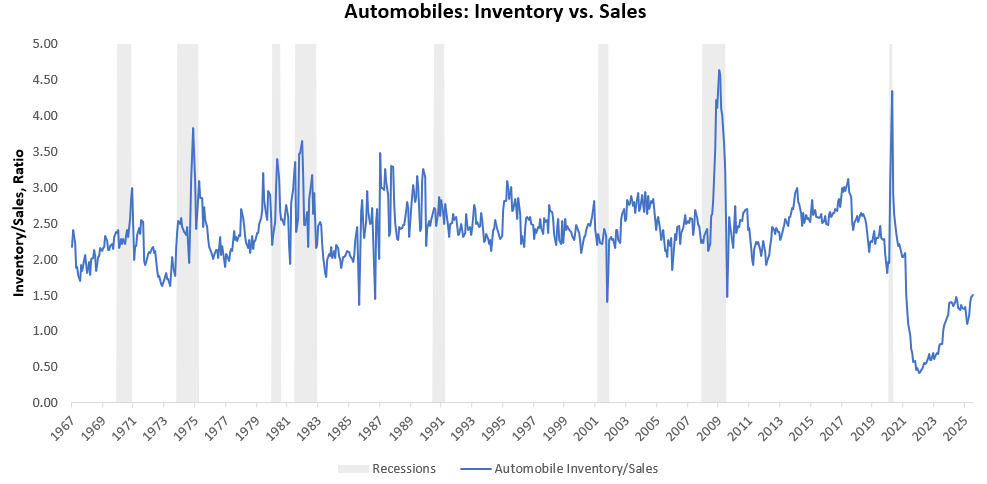
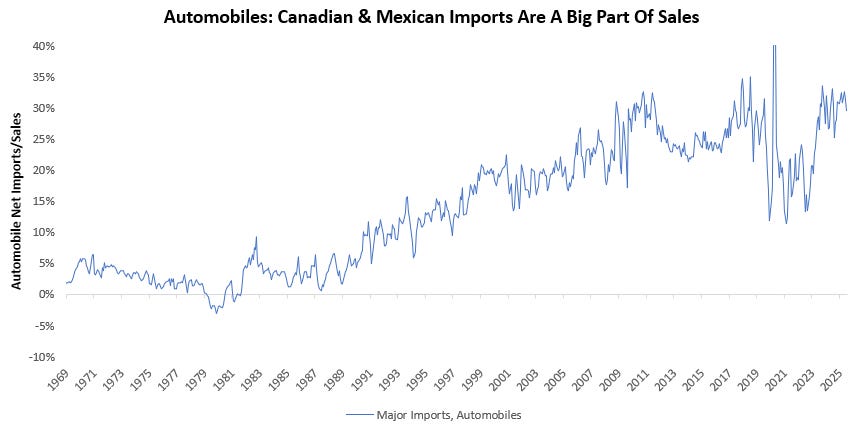
Trade tensions and a secular shortage of automotive inventory will likely keep autos a net support to inflationary pressures.
Inflation remains above the Fed’s target. There is potential for housing and energy to come together to bring us into a more disinflationary regime, though transportation is unlikely to comply. However, we have yet to see a meaningful shift in the dynamics. For now, we stay in an uncomfortable spot for the Fed —and, in turn, the bond market.