The Observatory
Slower Growth, Tightening Liquidity: Coming Soon
The Observatory is how we systematically track the evolution of financial markets and the US economy in real-time. Due to the strong demand for the product, we will start sharing the beta version of The Observatory (click to download) as we finalize its designs. This will offer a high-frequency resource to those using our systematic macro approach, allowing them to “Observe” the macroeconomy through our quantitative lenses. We will soon be launching the product officially, i.e., with explainer materials and a standardized format. And don’t worry, it’s all still free! Also, make sure to follow us on Twitter for timely updates:
Without further ado, let’s dive into what our systems are telling us:
Markets: Yesterday was a (-) L day, with commodities and stocks down, treasuries weaker, and the yield curve flatter. The curve's flattening was a bear flattening, i.e., short-term rates rose faster than long-term rates, as a similar dynamic that we saw during the last period of interest-rate liftoff. This markets pricing was a difficult day on the beta rotation side, with betas all down in unison. However, from an alpha generation perspective, our long exposures to Lean Hogs continued to pay off. An interesting dynamic and prospective opportunity is emerging in the US Treasury market. Markets have rapidly moved to price several rate hikes this year. However, our systematic forecasts for growth and inflation show high chances that these will both decelerate, just after the Fed's first chance to hike in March. In the event these decelerations materialize, there will be a significant chance of repricing, especially on the short-end of the Treasury curve. Nonetheless, these are strategic thoughts, and our systems will guide the way forward.
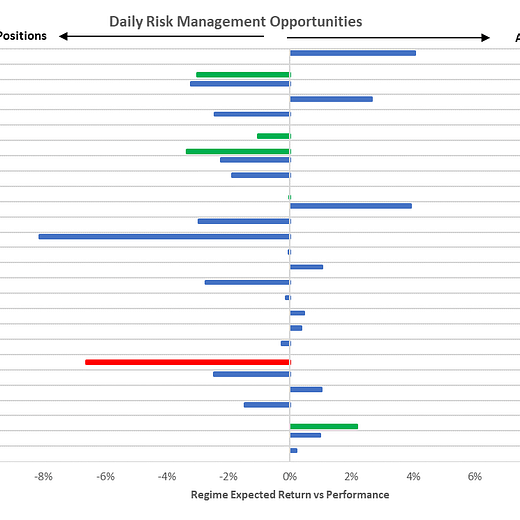
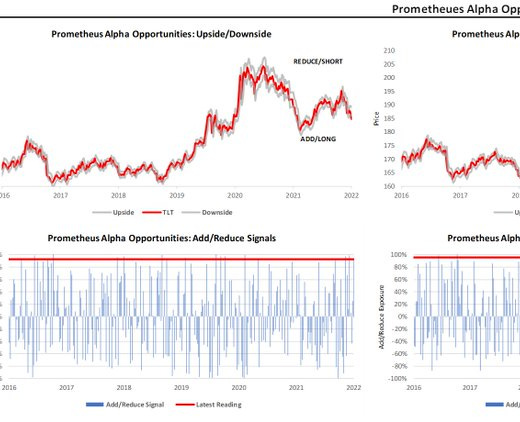
To summarize our systems' current assessment: Our Market Regime Monitors show a dominance of (+) G (+) I extended. Our Momentum Monitors show Commodities continue to have surging trend support, with a Momentum Score of 100%. This dynamic bodes well for Commodities, which are are typically a trend following asset. Consequently, our expected return and risk analysis tell us that the best opportunities are Long: Bonds, Cotton, Lean Hogs, Cattle, Sugar, and Short: Communications. However, our Risk Management Monitors indicate that we can ADD to LONG: Bonds& Cotton. We can REDUCE our LONG: Lean Hogs, Live Cattle, & Sugar and SHORT: Communications. Resultantly, our Expected Return Strategy is LONG: Bonds & Lean Hogs.
Macro: We are ending a relatively light week in economic data; however, the data we received (CPI) shook up markets significantly. With the Fed's accelerated taper, ending early March, and with a prospective rate hike, in addition to a slowdown in growth data, the impact on markets is likely to be significant in the coming weeks.
To summarize our systems' current assessment: Economic Momentum edged up marginally this week but remains relatively unchanged along with our GDP Nowcast. The trend remains lower in sequential data. The deceleration we saw in economic data this month is likely to worsen in March. Our systematic forecast points to significant slowdowns. Inflation remains resilient; however, just like growth, it will fall prey to cyclicality in two months. Our Inflation Nowcast has stabilized at a relatively high level. While our systems estimate that inflation will decelerate, this means that it can still slow to a higher level than we have experienced in pre-pandemic years, i.e., the potential inflation trend could be higher than pre-pandemic.
The future is dynamic, and our systems adjust as new information is available. Our bias is to allocate for the existing regime while trying to peek around the corner to what the future may hold. Finally, we optimize these views to minimize portfolio risk, resulting in our trading signals. We show all this in the document below.
Click here to enter The Observatory.


