The Observatory
Liquidity tightening
The Observatory is how we systematically track the evolution of financial markets and the US economy in real-time. Due to the strong demand for the product, we will start sharing the beta version of The Observatory (click to download) as we finalize its designs. This will offer a high-frequency resource to those using our systematic macro approach, allowing them to “Observe” the macroeconomy through our quantitative lenses. We will soon be launching the product officially, i.e., with explainer materials and a standardized format. And don’t worry, it’s all still free! Also, make sure to follow us on Twitter for timely updates:
Without further ado, let’s dive into what our systems are telling us:
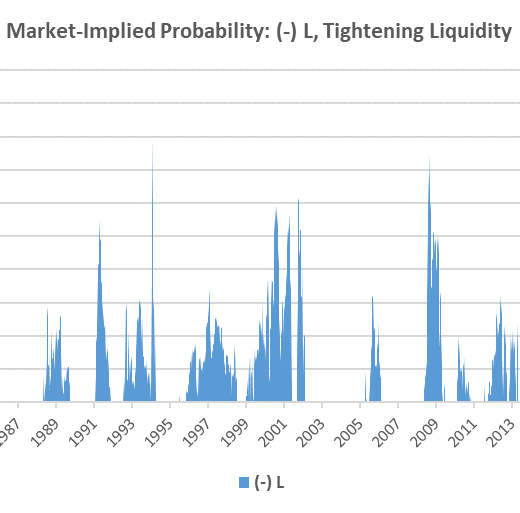
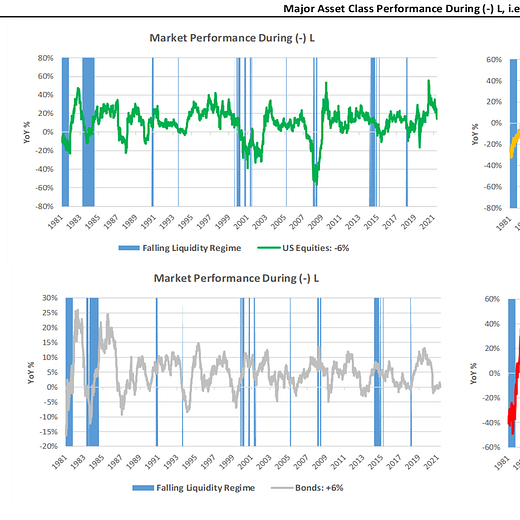
Markets: After a volatile week, US equities managed to close the week in the green, and commodities continued their dominant run, continuing their streak as the best performing asset year-to-date. There has been a considerable divergence internally within these pro-growth asset aggregates, creating opportunities for our systems to exploit. Resultantly, our systems have triggered signals both long commodities and short equities, which offers us a solid risk-reducing pairing. We also showcase our upgraded Market Implied Regime Monitor, which includes a liquidity dimension. Consequently, we highlight the looming threat of a (-) L regime, i.e., tightening liquidity. We explain more on page 3. To summarize our systems’ current assessment: Our upgraded Market Regime Monitors continue to confirm the dominance of (+) G (+) I; however, we also see that the probability of (-) L has risen significantly. (-) L environments tend to be challenging for growth assets. Equities (-6%), commodities (-18%),and gold (-16%) all fall during (-) L on an annualized basis. The degree of this pricing is significant, and we could see a shift within the next week from (+) G (+) I to (-) L reasonably quickly. Consequently, our expected return and risk analysis tell us that the best opportunities are Long: Bonds, Cotton, Lean Hogs, Cattle, Sugar, and Short: Communications. However, our Risk Management Monitors indicate that we can ADD to LONG: Sugar and SHORT: Communications. We can REDUCE our LONG: Cotton, Lean Hogs, and Cattle. Our Expected Return Strategy has exited these positions and is now LONG: Sugar & SHORT: Communications.
Macro: We will receive a host of economic data this week, including a variety of PMI data, employment data, and some real-economic data- ISM data, jobless claims, and unemployment rate data are likely to be top of mind for markets. Until March, the primary focus of data digestion for markets will likely be assessing the Fed’s reaction function to the data- “slowing but growing” data could prove dangerous. To summarize our systems’ current assessment: Economic Momentum still sits in an uncomfortable zone. Both Economic Momentum and our GDP Nowcast moderated marginally higher late last week. We will receive a slew of data this week important to both. Our leading liquidity indicators are starting to see pass-through effects- with a lead time of approximately 12 months. They will likely impact the economy and market in H1 2022. We see this happening in the real economy, with decelerating momentum. Further, our Market-Implied Regime measures are beginning to confirm asset markets increasingly discount the tightening policy impulse. Mechanically, these moves should strengthen and continue as the Fed becomes more restrictive in its liquidity provision.
The future is dynamic, and our systems adjust as new information is available. Our bias is to allocate for the existing regime while trying to peek around the corner to what the future may hold. Finally, we optimize these views to minimize portfolio risk, resulting in our trading signals. We show all this in the document below.
Click here to enter The Observatory.


