The Observatory
Staying Short Treasuries & Equities
Welcome to The Observatory. The Observatory is how we at Prometheus monitor the evolution of the economy and financial markets in real time. The insights provided here are slivers of our research process that are integrated algorithmically into our systems to create rules-based portfolios.
If you haven’t already, check out Episode 3 of the Prometheus Podcast! For this episode, we have the pleasure of once again hosting Darius Dale, Founder & CEO of 42 Macro. For those of you who missed our previous conversation, we highly recommend you give it a listen for a better understanding of his sophisticated framework (Click here). While in our last conversation, we focused more on mechanics, today we’re going to spend our time discussing the current state of the economy & the outlook for markets. Aahan & Darius traverse the US macro landscape, discussing everything from the Fed & inflation to the reverse repo facility and portfolio strategy. This episode is a must-listen for anyone seeking to manage macro risk during one of the most economically volatile periods in history.
Below are the top observations coming from our systematic tracking of economic conditions:
i. The trajectory in real incomes remains lower. While nominal incomes continue to stay elevated, we are witnessing a weakening in real incomes, primarily from wages rather than labor. Below, we show our estimates of real employee compensation relative to the official data:
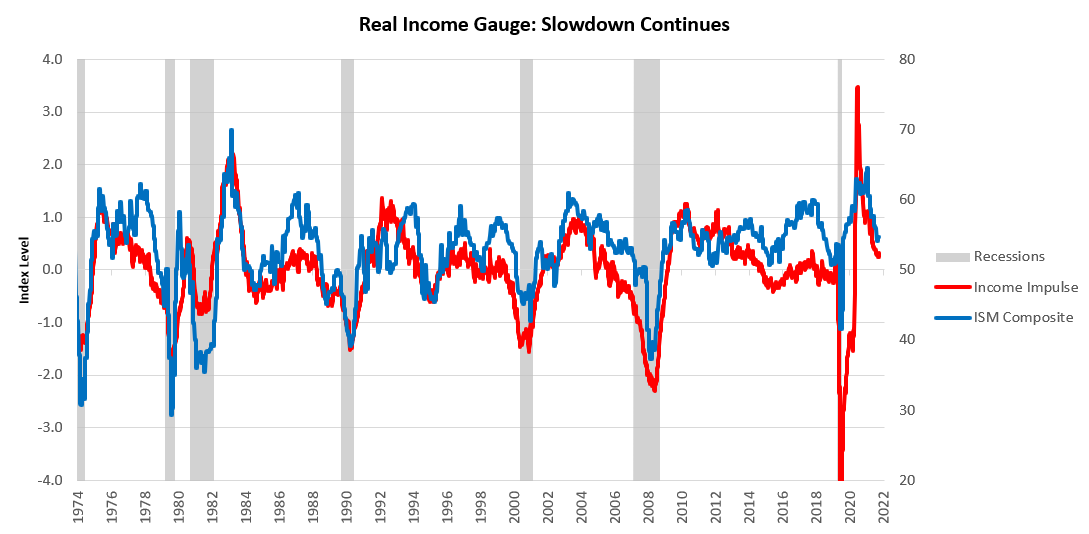
Aggregating our measures of real incomes, our proprietary measures of the real income impulse continue to suggest that we are very close to a turning point for real income:
As these pressures mount, the outlook for equity & credit returns continues to be a dim one.
ii. Pressures on production continue to mount. We continue to see a deterioration in real manufacturing new orders. Real manufacturing new orders decreased by -1.04%, with durable goods and nondurable goods contributing -0.07% and -0.97%, respectively. On a real basis, we estimate that total manufacturing new orders have decreased -by 4.15% versus one year ago. We show the composition of these yearly changes in the data below:
We should note that this immense contribution of weaker nondurable goods orders is an aberration- usually, durable goods command the lion’s share of manufacturing new orders. As we will see in the following section, this decline in orders also preceded a significant contraction in the nondurable goods manufacturing industry. This is an initial sign of weakening demand. Furthermore, manufacturing new orders is at odds with industrial production, telling us there is pressure on industrial production to fall.
While there is room for production to rise, the current levels of inventory build and declining real income are more likely to pass through to lower production rather than vice-versa.
iii. Labor markets remain tight, but this is increasingly a risk rather than a strength. While it is well understood that tight labor markets allow more room for the Federal Reserve to tighten monetary policy, it is less well understood that labor markets are now central to sustained economic activity and avoiding stagflation. Below, we show aggregate incomes can be broken into wages, hours worked, and employment. As we can see, employment is what is keeping real wages positive:
We remain in a strong and expansionary labor market, though pressures continue to build on real incomes to decline through stagflationary dynamics alongside tightening liquidity. Today’s nonfarm payrolls data offered us some further insight into these dynamics, suggesting the first inclinations of weakening real demand passing into the labor market in the form of a contraction in nondurable goods manufacturing employment:
Now, while we have seen what may be the first of other contractionary readings to come, it is essential to zoom out to understand the strength and resilience of the current labor force growth:
Over the last year, Retail Trade (0.31%), Transportation and warehousing (0.37%), Professional and Business Services (0.74%), Education and Health Services (0.57%), & Leisure and Hospitality (1.31%). have been the primary drivers of the 4.56% growth in the labor market. As we can see above, labor market strength is relatively concentrated in these sectors, exposing real aggregate incomes to losses emanating from these sectors. We have seen indications of this in more procyclical areas of the economy, but our systems wait and watch for further confirmation of these trends to confirm positioning changes.
Systematic Positioning
Overall, while we see pressures continuing to build real output, spending, and labor markets— we remain in an environment of stagflationary nominal growth and tightening liquidity. This fundamental backdrop is further confirmed by our market regime monitors:
This market environment creates a set of regime-expected returns which are extremely different from what most investors are used to, i.e., most equities, credit, and bonds shave negative expected returns during these environments:
For ease of access, we show the regime expected returns of these traditional assets below:
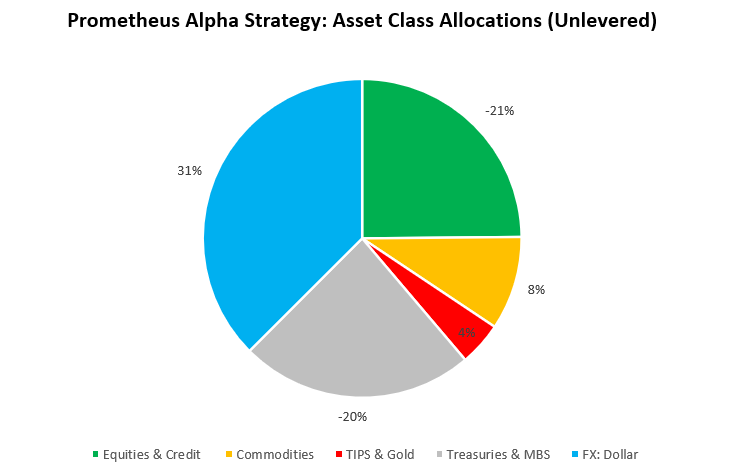
Netting out our fundamentals measures, market regime dynamics, and other timing factors, our systematic Alpha Strategy is once again short equities, credit, & fixed income. Additionally, our systems continue to hold inflation hedges and the dollar on the long-side:
Our Alpha Strategy has performed very well on a year-to-date basis, serving as a strong guide for positioning. We show the full-sample backtest history for our Alpha Strategy below:
Stay nimble.


I don't understand the market regime monitor.
I get the first four column headers, they're the classic view of +/- growth crossed with +/- inflation. But what is -L? A fudge factor?
And what do these row headers mean? My guesses ... The first four row headers -- the probabilities -- they look at relative performance of asset classes over different time windows, and correlate them with the four regimes, where a 100% would mean it's a perfect match with a regime. The fifth one, it's how much time on average we're in that regime.
Is my interpretation correct?