
The Observatory
Fuel For Spending Drying Up

Welcome to The Observatory. The Observatory is how we at Prometheus monitor the evolution of both the economy and financial markets in real-time. Here are the top developments that stand out to us:
i. Pressures are increasing on consumer spending. The latest wage data suggest the potential for respite in personal spending, suggesting the potential for a sequential acceleration in employee compensation, which could, in turn, be spent on the economy. However, the tightness in labor markets suggests there is little room for further gains coming from sustained employment growth. Furthermore, inflationary pressures continue to eat away at real wages, creating a challenging environment for future spending. Our systems algorithmically detect periods where inflation is elevated relative to incomes and labor markets are tight to understand the path for income & spending better. We show this below:

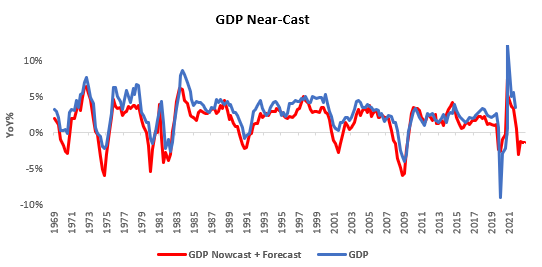
During periods of inflationary, tight labor markets, year-over-year income and consumption measures tend to deteriorate significantly on an annualized basis. This dynamic implies a more challenging road ahead for GDP growth, which is already reasonably weak:
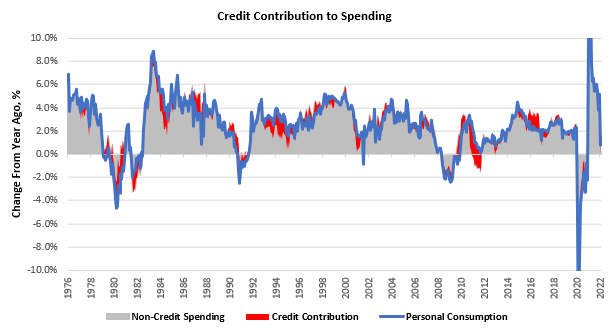
ii. Borrowing isn’t adequate to sustain spending growth. There has been a great deal of focus in the media on the quantity of installment consumer borrowing in the economy; however, when we reconcile these numbers with the impulse to personal spending, we fund their effect to be minimal. At current borrowing rates, credit uptake could result in a modest 0.3% improvement in year-over-year personal spending. Given the current state of financial conditions, assuming a sustained credit impulse doesn’t make sense to us.
iii. Markets continue to price stagflationary nominal growth and tightening liquidity. This market pricing is supported by our fundamental, high-frequency nowcasting of economic conditions. We show our market regime monitor below:

Additionally, we show our high-frequency tracking of growth and inflation, along with historically analogous periods:

Growth continues to deteriorate; inflation remains elevated. Furthermore, liquidity conditions continue to tighten, telling us that that growth will remain weak:

Our systems apply these concepts algorithmically to create rules-based portfolios. Within this context, our ETF Strategy ended last week roughly flat, despite significant volatility in equity markets. Thus far this week, commodity exposures have generally been winners, alongside high yield shorts. We show the week-to-date-performance of our systematic strategy below:

We show the YTD cumulative return for the ETF Strategy as well:

Our systems continue to tell us that inflation is persistent while growth continues to trend lower. Liquidity conditions have tightened and are likely to get worse. Our systems aggregate our analysis in an algorithmic, rules-based fashion to create portfolios with attractive risk-reward ratios. For next week, here are how our systems are looking to be positioned based on both fundamental and market data:
Stocks: SPY (-5%), XLP (5%), XLY (-3%), XLC (-5%), XLV (5%), XLB (5%), XLI (-5%), XLK (-4%), XLF (-4%), XLU (5%), XLE (3%)
Commodities: DBC (3%), USO (2%), UGA (2%), UNG (2%), CORN(3%), SOYB(4%), CANE(4%), WEAT(2%), GLD (6%)
Fixed Income: HYG (-10%), TIP (13%)
Dollar: UUP (12%)
At the asset class level, our signals net out to an exposure that remains short equities & credit:

This allocation has a probability-weighted loss of -3.1% and a max loss of -6.7% in a three-sigma event. Volatility continues to rise across asset classes, consistent with what we have seen during previous periods of Quantitative Tightening.

Read our note on the path for Quantitative Tightening by clicking here.
With inflation persistent, the growth impulse weakening, liquidity tightening, & volatility rising, capital preservation plus active shorting remains the key to success. We continue to think our systems are well prepared for such an environment as they have been in the past:

Stay nimble!
How do you come to this conclusion “Markets continue to price stagflationary nominal growth and tightening liquidity” when your graphs show +G+I at 57%? And stagflation -G+I at 0%?
Little caveat on spending, savings have reached historical highs and households have enough savings to survive higher inflation. Also can you link your publication on the L(-) regime.