

The U.S. economy continues to show mixed but stable conditions: labor data are weakening, and manufacturing is rebounding from contraction. Meanwhile, asset markets are trending higher across equities, bonds, and gold.
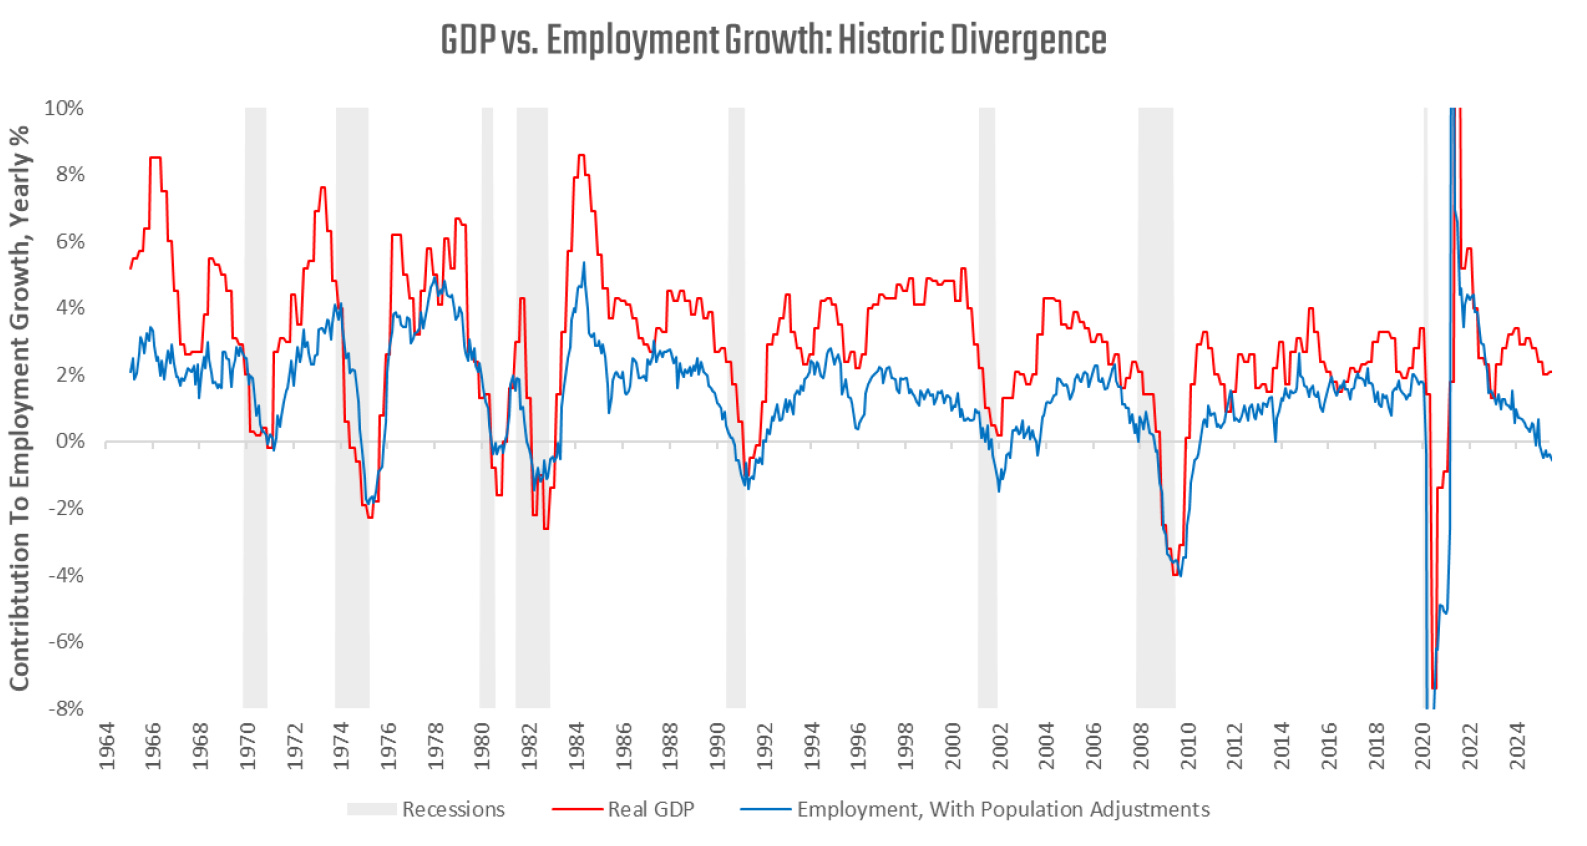
GDP growth remains near 2%, even as job creation slows. Immigration shifts are weighing on the labor force, not the business cycle. For now, spending continues to outpace labor growth — a sign of resilience, not yet a turning point.
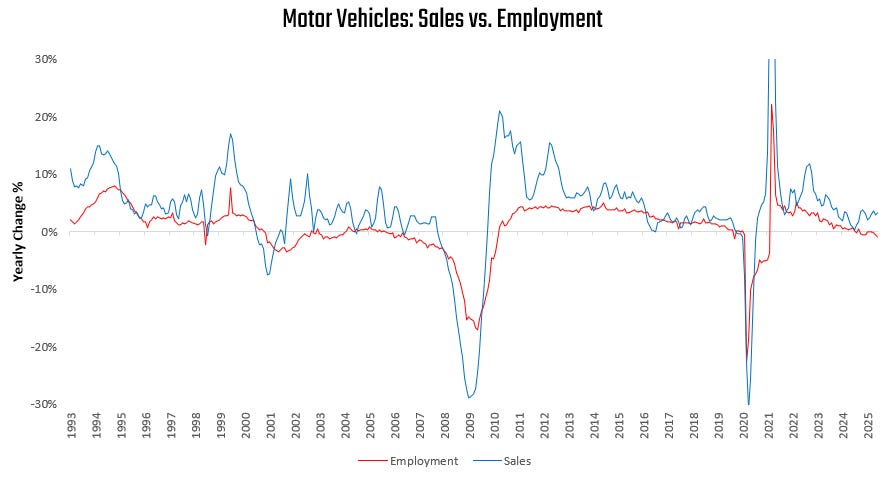
We see these divergences mirrored across the economy. The motor vehicle sector is a recent example where this divergence has been significant:
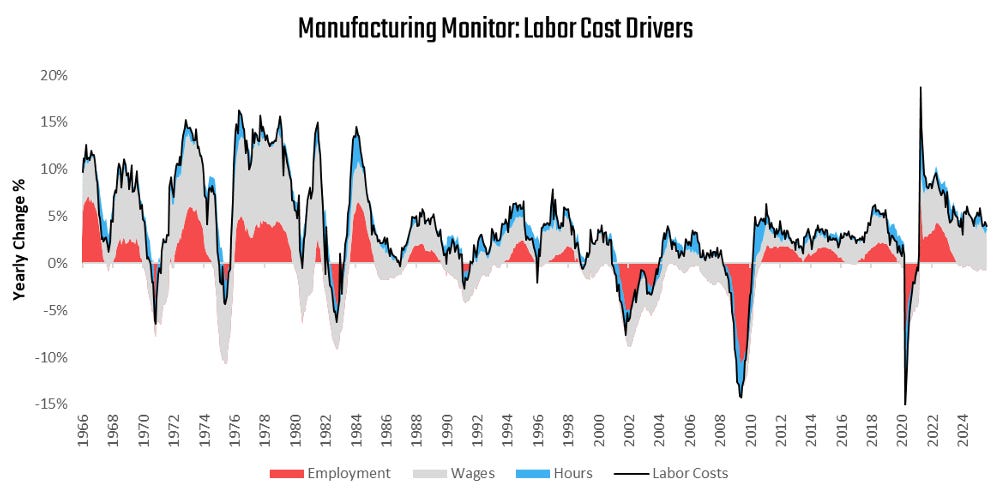
We have seen this in the broader manufacturing sector as well. However, manufacturing wages continue to rise despite falling employment:
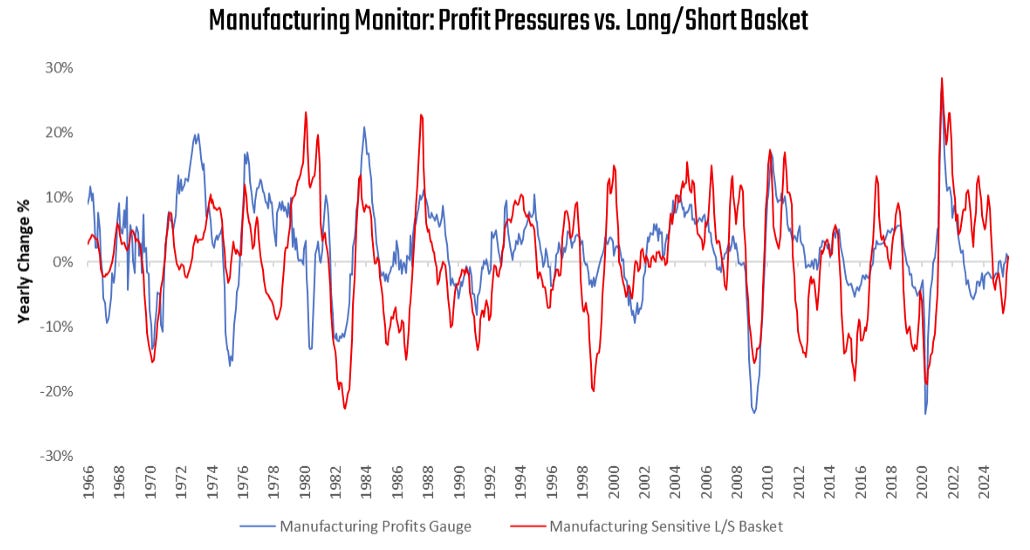
These wage conditions are not indicative of a recession, but rather of a nascent recovery. Manufacturing profits and new orders are recovering, while surveys have improved toward a neutral position. Capacity utilization remains subdued, but the direction of change is positive — early evidence that industrial activity is stabilizing. Our timely manufacturing gauges are showing nascent signs of a recovery:
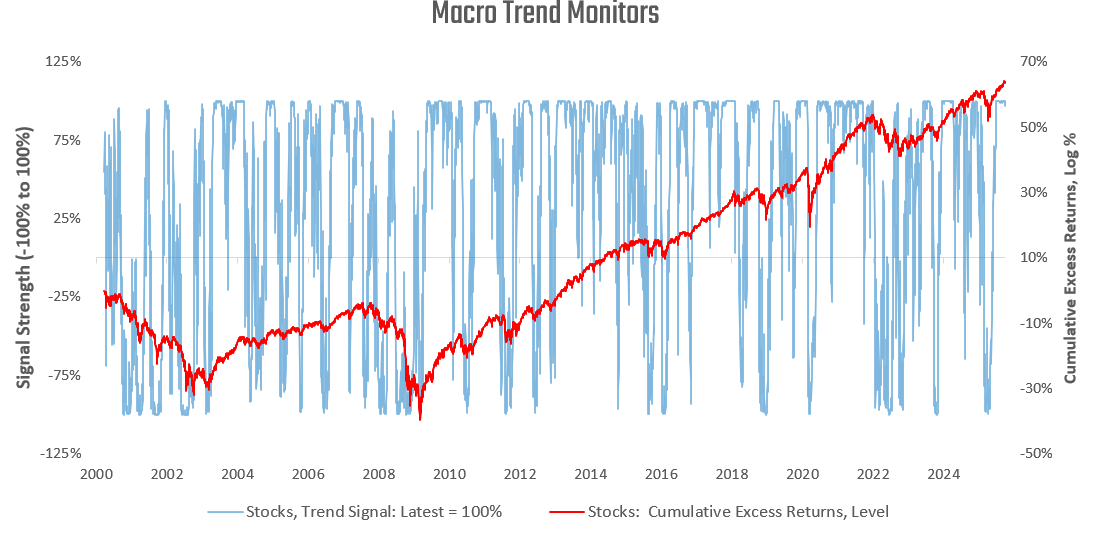
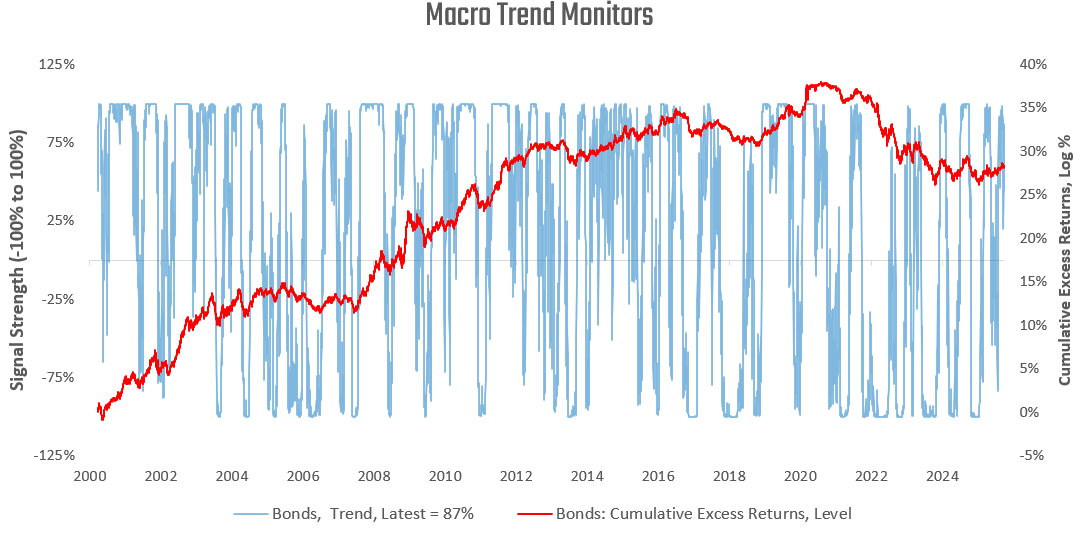
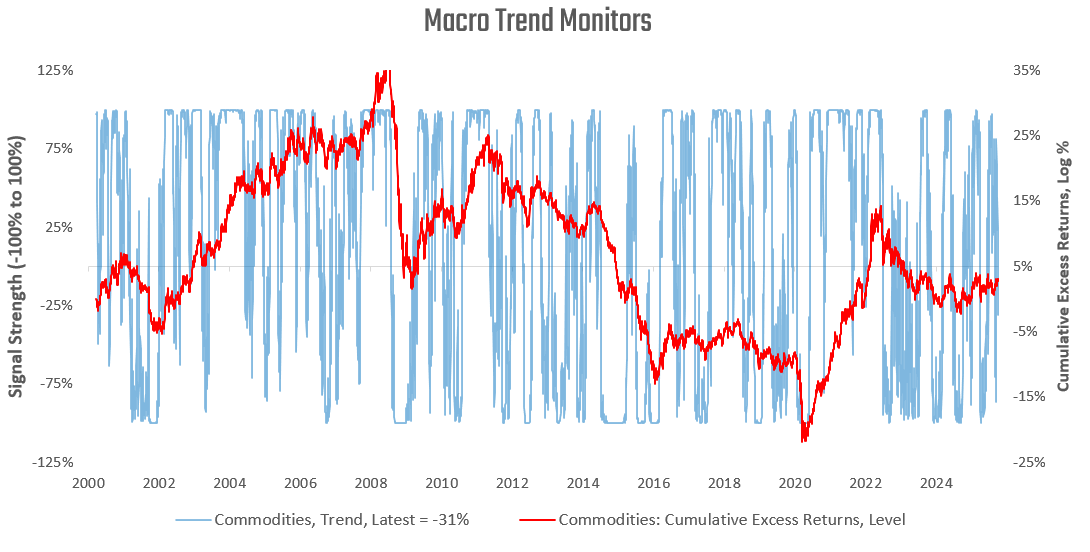
Turning to assets more broadly, our macro trend monitors show that markets are responding to stability in fundamentals:
Equities: Extremely strong upward trends.
Bonds: Significantly positive trends.
Commodities: Mixed, showing signs of instability. Industrials are strong, but the broader complex is more mixed.
Gold: Robust upward momentum.
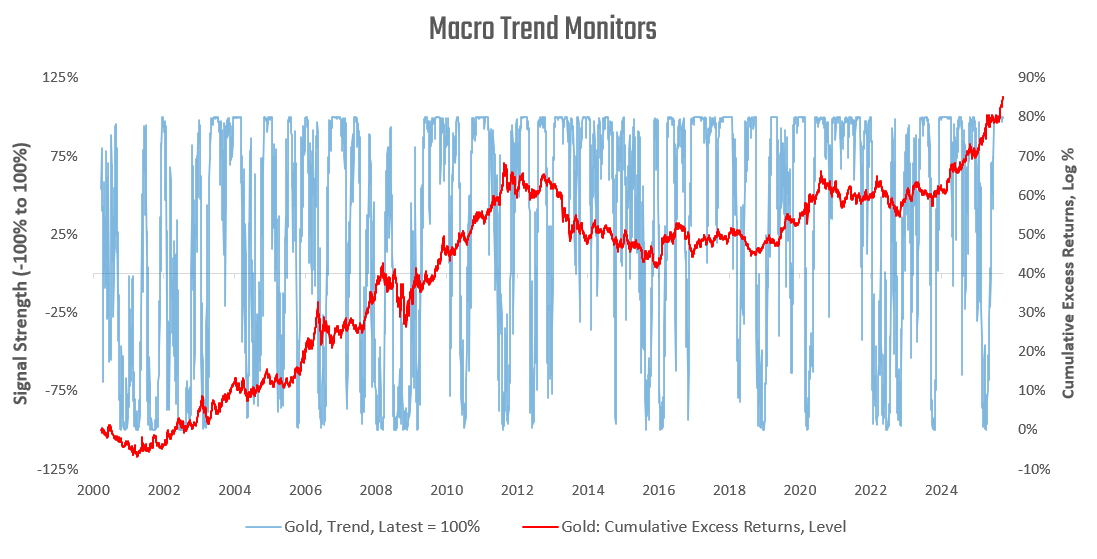
In aggregate, assets are trending higher, consistent with loose financial conditions and moderate macro volatility.
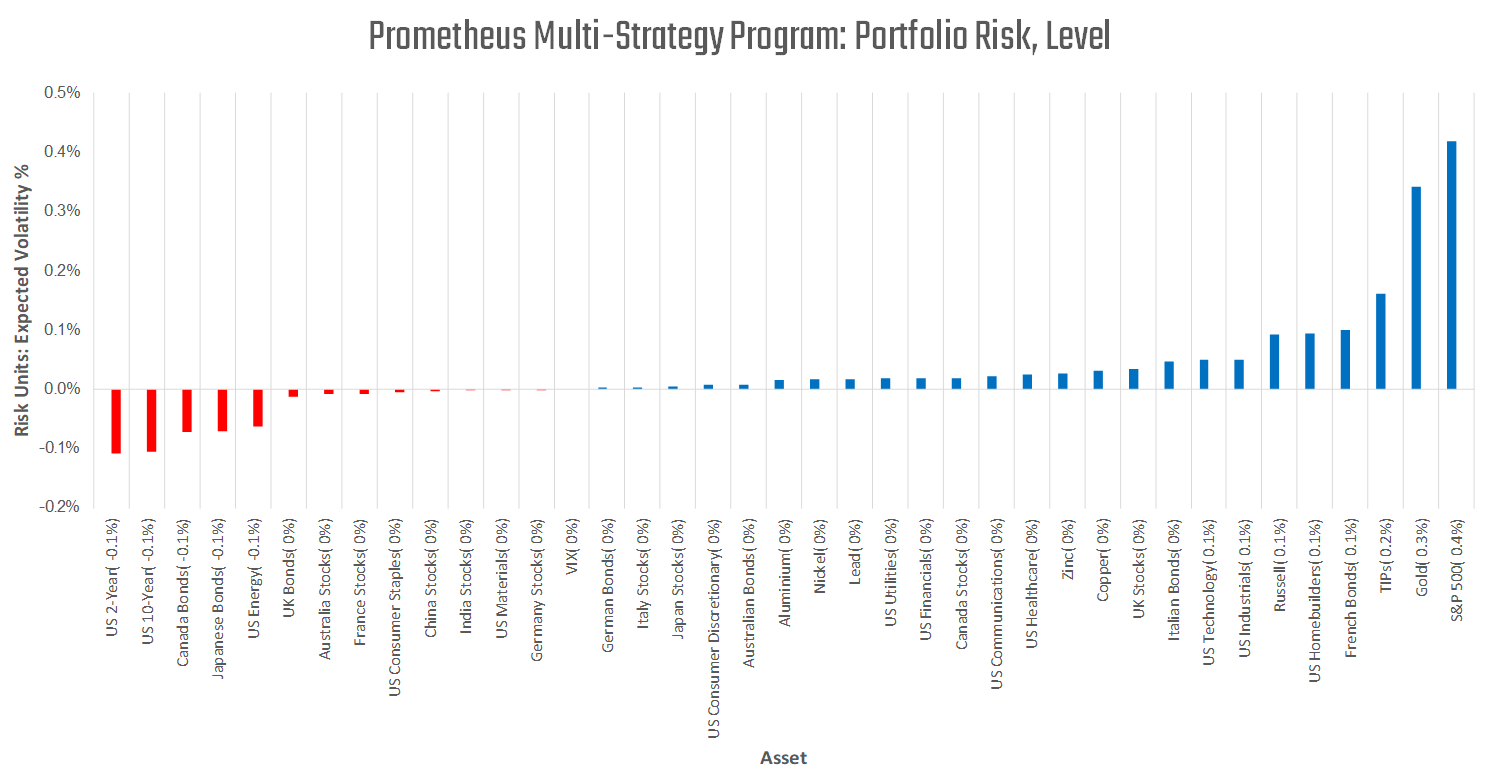
The Prometheus Multi-Strategy Program has recently capitalized on several of these trends by remaining long global stocks, gold, and industrial commodities:
For now, the program continues to maintain these biases. But the future is dynamic, and our systems will adapt as the data evolves. We will keep you updated as the outlook shifts.
Until next time.
Just curious at a high level what causes one of your asset positions to whipsaw like gold last week? The price action alone didn't seem very drastic so was it sitting on some kind of combined fundamental/trend inflection point or something?
Really cool graphs. For further clarity, what is the baseline for Cumulative Excess Returns, Log % for equities, bonds, commodities, and gold?
Is the baseline always the same (like cash)? Or does it differ per category?