
Reviewing The Big-Picture
Growth, Inflation, & Liquidity: Positioning For The Week Ahead

The dearth of official macroeconomic data persists, but markets continue. We review some non-official data sources as part of our ongoing process to navigate this period.
We begin with high-level growth. Our estimates for aggregate nominal employee incomes remain strong. We visualize this below:
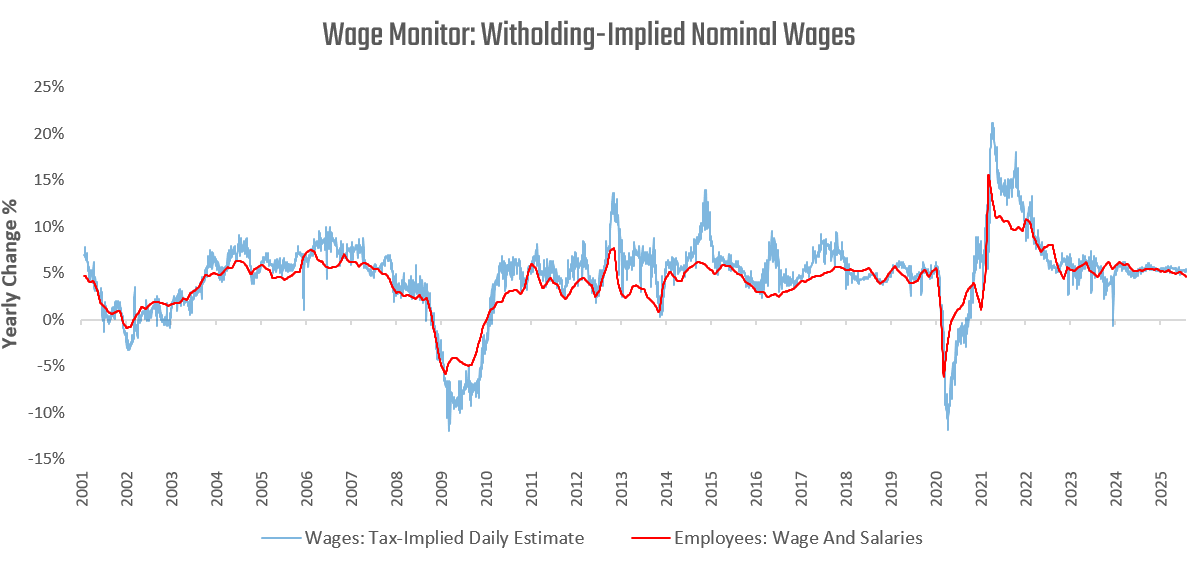
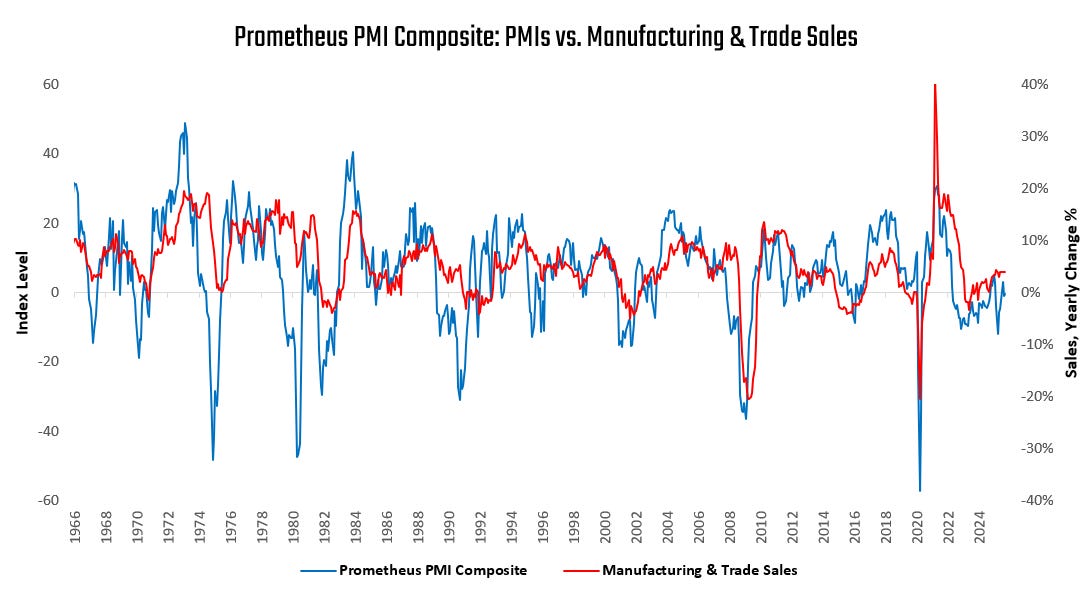
This daily gauge of nominal incomes largely aligns with GDP conditions, suggesting nominal GDP growth remains strong. Now, within that strong aggregate picture, there do remain indications of weakness. The latest PMI readings continue to show manufacturing and trade sectors continuing to battle their way out of contraction:
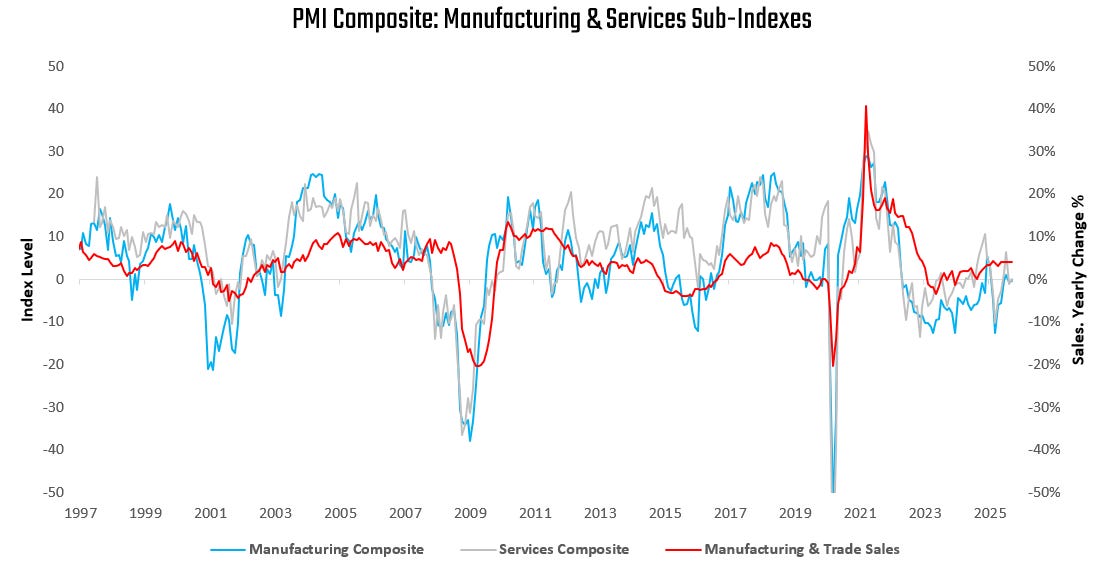
These dynamics hold across the manufacturing and services sectors:
We see this reflected in our estimates for Russell 2000 earnings as well, which contains more cyclically oriented companies than the S&P 500:
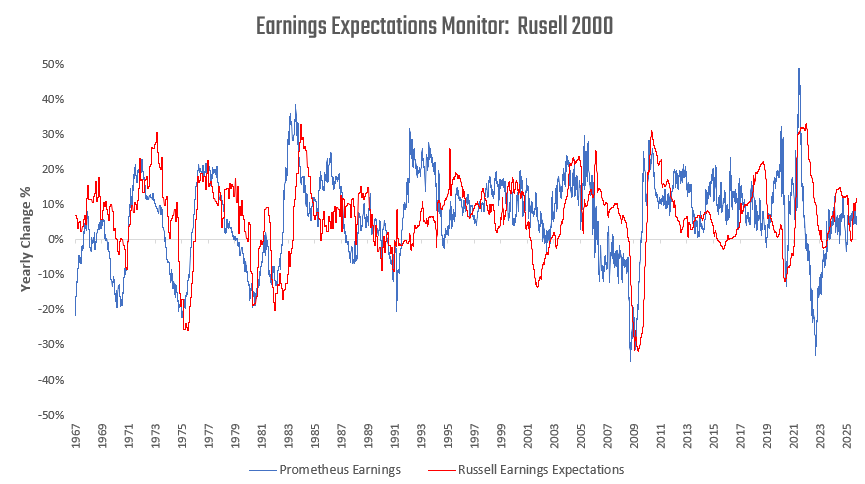
While our measures don’t point to contraction from Russell 2000 earnings, they do point to a stabilizing pace of growth and perhaps some mean reversion ahead for earnings expectations.
Under these nominal growth dynamics, inflation remains above the Fed’s comfort zone, though disinflationary forces are building in housing and energy. Shelter inflation continues to slow alongside weak housing demand, while energy prices are stabilizing as inventories normalize.
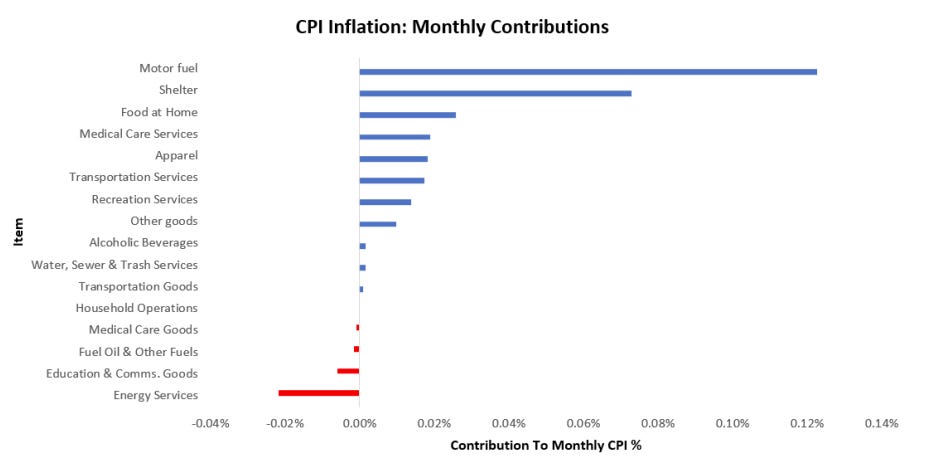
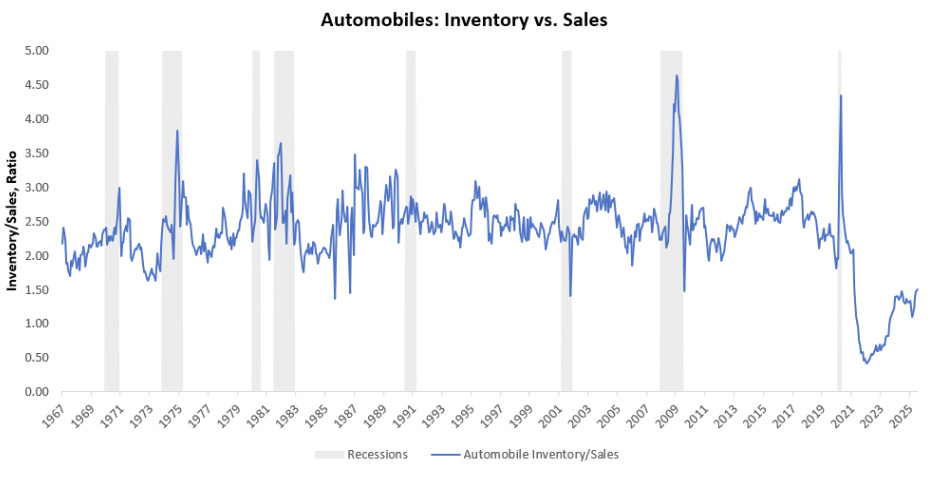
However, auto shortages continue to provide a floor to price pressures.
The combination of these dynamics keeps us from the Fed’s 2% objective.
Our monetary policy gauges measure the pressures on the Federal Reserve to move monetary policy based on the trade-off between growth and inflation data. The higher our readings, the more pressure there is to hike policy rates. The lower the gauge, the more pressure there is to cut policy rates.
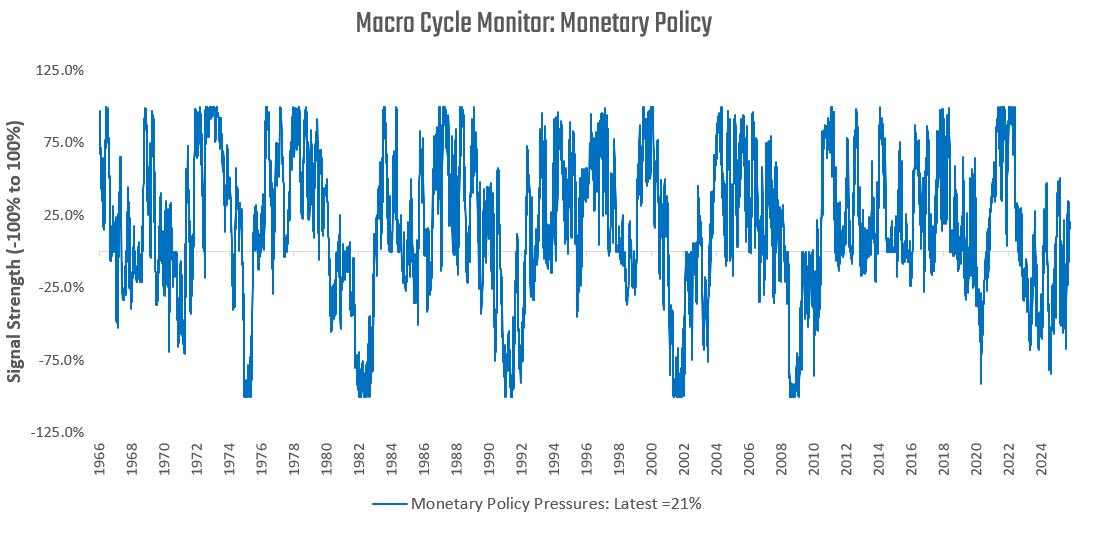
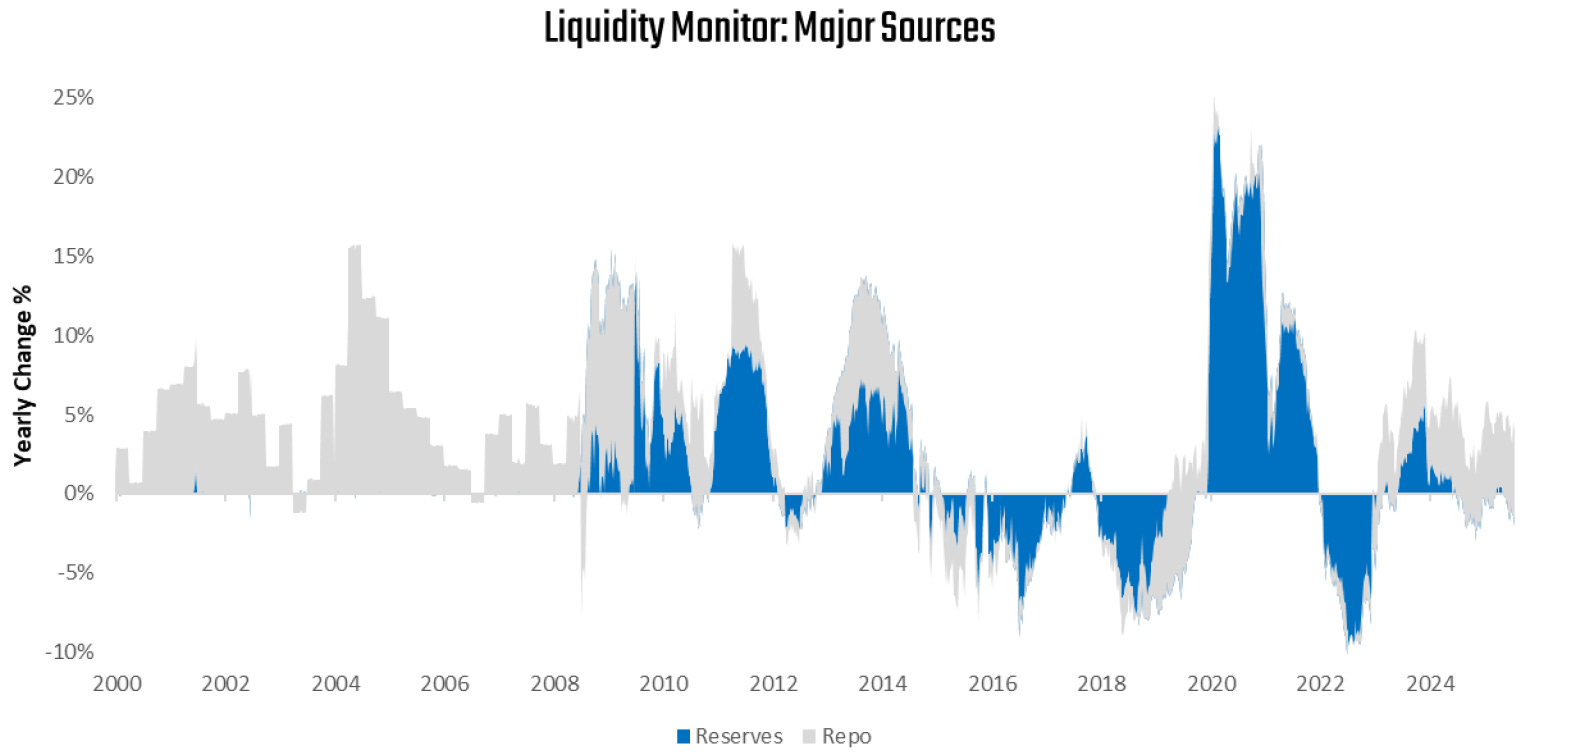
Pressures on monetary policy remain biased towards tightening. While this pressure to tighten from the real economy persists, financial liquidity remains ample.
With the Federal Reserve’s balance sheet actions slowing, the dominant driver of liquidity dynamics remains the repo market. We isolate this below:
The primary concerns we see expressed by market participants today are about the stability of repo markets, particularly the widening of SOFR spreads. While these spreads have indeed widened, adding a little historical perspective reduces our concerns:
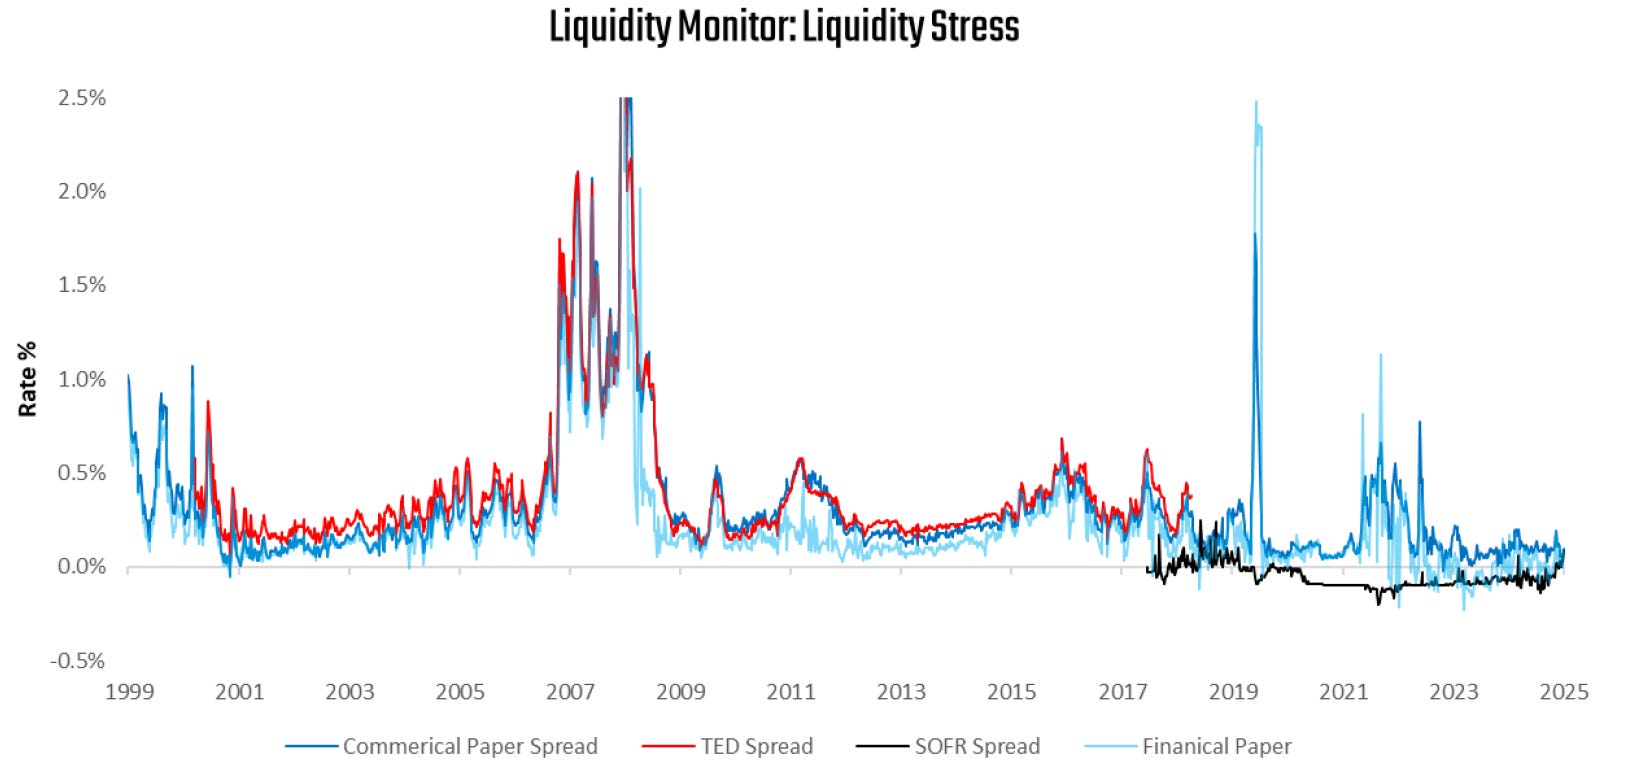
As we can see, while there has been a rise in SOFR spreads, the rise is extremely small relative to historical periods of stress (2007, 2029, 2022). We see this lack of stress confirmed via repo volumes. We visualize this below:
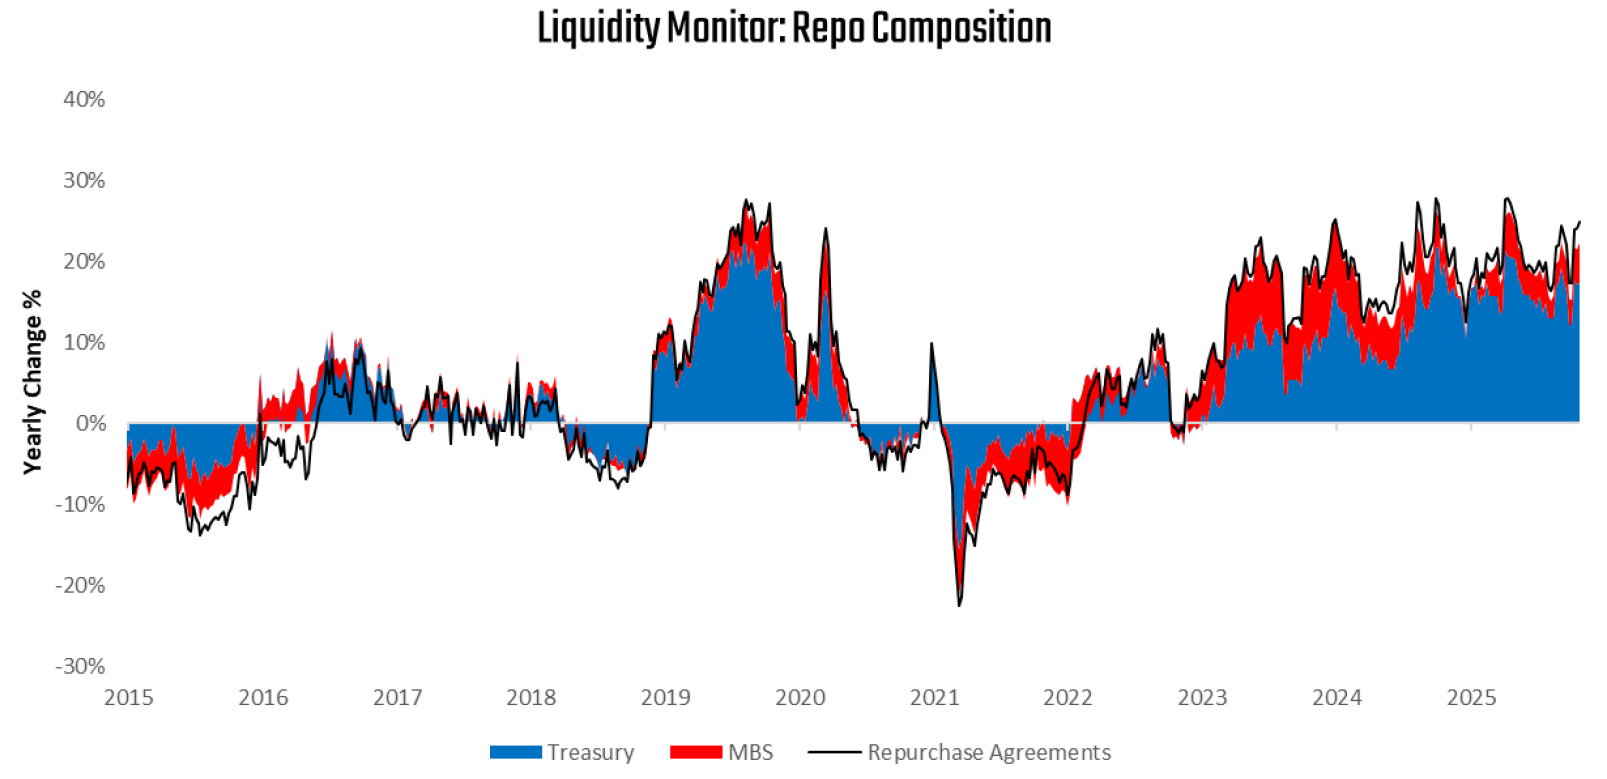
Repo activity continues to expand at a strong pace, supporting assets broadly.
Positive broad-based nominal growth, elevated inflation versus the Fed’s target, and ample liquidity have continued to keep cross-asset reflationary trends going. We see these in our latest macro regime probabilities:
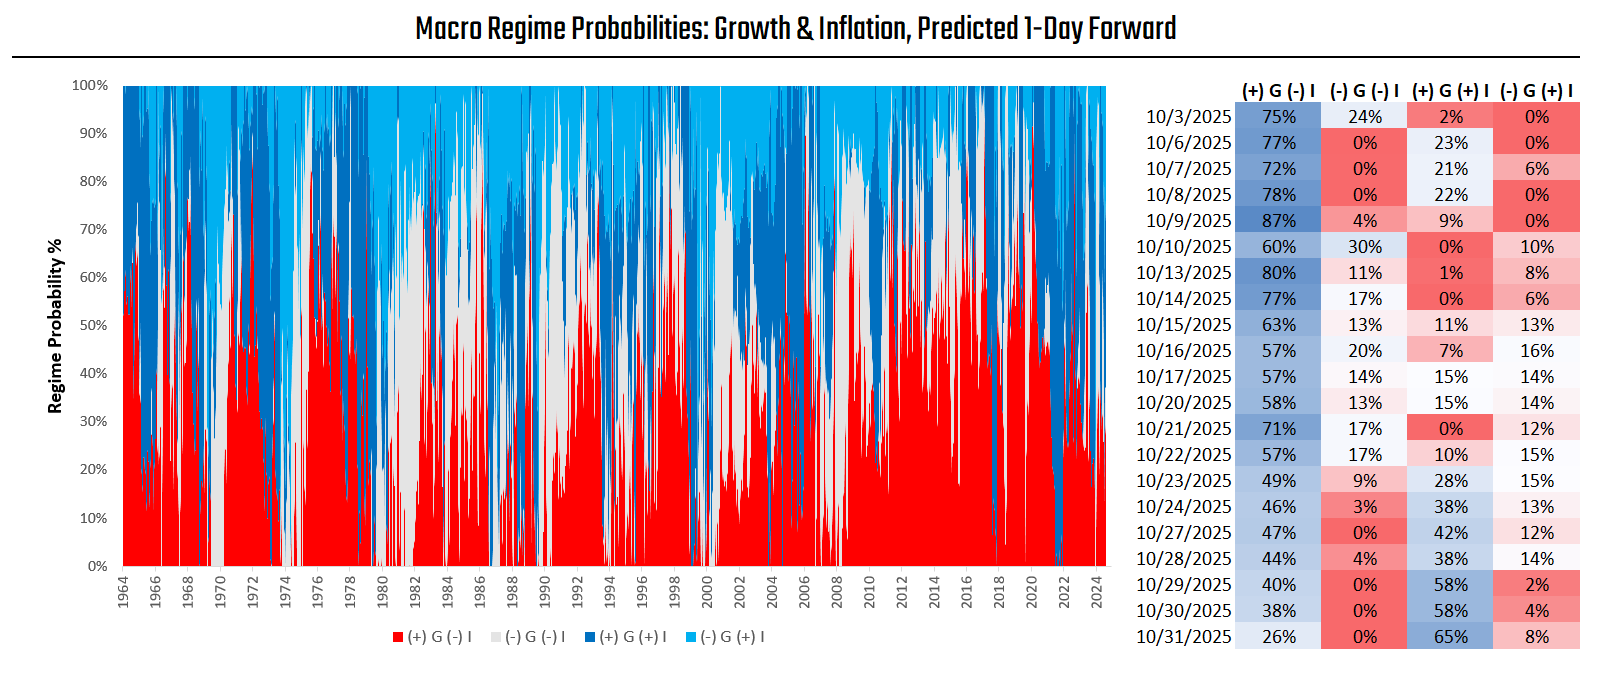
Rising nominal growth outcomes continue to dominate macro regime probabilities. A pro-cyclical bias towards asset allocation remains warranted.
Amidst this backdrop, the Prometheus Multi-Strategy Program has been steadily re-adding risk and rebalancing exposures across equities, bonds, and commodities. The program’s posture is once again long growth and short duration—consistent with a reflationary shift:
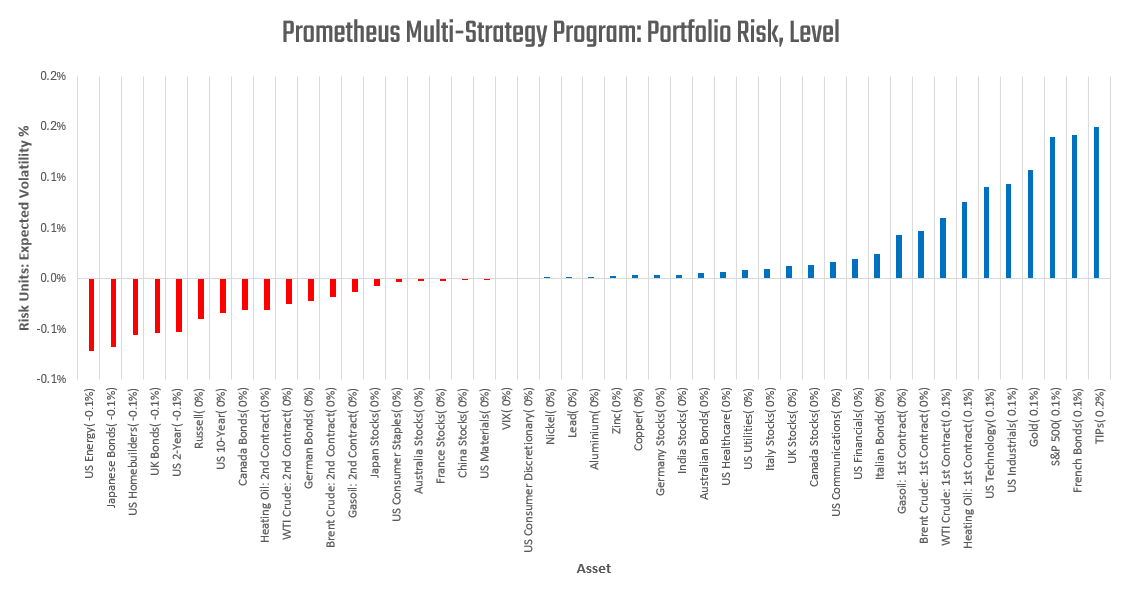
The program is entering the week-long equities, short nominal fixed income, and modestly long commodities.
The future is dynamic, and our systems will adapt as the data evolves. We will keep you updated as the outlook shifts. Until next time.