

At Prometheus, we pride ourselves on continuously refining our systematic process. Today, we share our thoughts on the latest evolution of our systematic process, our Macro Regime Monitors.
Consistent readers and clients will likely be familiar with our approach to using market regime monitors to identify trends. For those who are unfamiliar with this approach, we suggest reading through this Macro Mechanics note:
What Is A Market Regime?

The best information we can ever provide investors is the mechanics of how we think about macro conditions over time rather than what we think about them at any particular time.
Our new Macro Regime Monitors are a continuation and improvement of our market-implied regime probabilities. Defining them concisely:
Our Macro regime monitors combine measures of macro trend, macro mean reversion, expected returns, and fundamental economic conditions to estimate tomorrow’s cross-asset, macro market environment.
We think this comprehensive approach to regime recognition captures all the major drivers of asset markets into a single definition. As a refresher, we believe two economic factors determine the relative returns between asset classes: growth & inflation. The permutations of growth and inflation:
(+) G (-) I: Rising Growth & Falling Inflation
(+) G (+) I: Rising Growth & Rising Inflation
(-) G (-) I: Falling Growth & Falling Inflation
(-) G (+) I: Falling Growth & Rising Inflation
Note that we have excluded liquidity as a driver above. This is not because liquidity is not a meaningful driver of macro markets but rather because its application to markets is significantly more nuanced and much more amenable to the relative value of credit spreads, yield curves, and macro asset differentials than betting on assets like stocks, bonds, commodities, and gold.
Returning to our Macro Regime Regime monitors— markets price these permutations of changes in growth and inflation with varying degrees of conviction on any given day. Typically, we can see these regimes in the relative price movement of assets. Each regime mechanically benefits specific assets:
(+) G (-) I: Stocks & Credit
(+) G (+) I: Commodities
(-) G (-) I: Treasuries
(-) G (+) I: TIPs
Thus, examining the relative performance of these assets allows us to estimate today’s regime. For instance, if stocks fall, commodities fall even more, while treasuries rally more significantly than TIPs— we are more confident that markets are moving in a manner consistent with (-) G (-) I than other alternative scenarios. As macro investors, we largely want to be able to invest in a manner consistent with tomorrow’s macro regime. Knowing today’s regime is relatively straightforward, but the question is whether today’s regime can persist into tomorrow.
To do this, we need to apply bottom-up forecasts for each asset primary asset class and compare those forecasts relative to each other to understand what is likely to dominate price action. This approach is dramatically different from our original programs (circa 2020) and what we see used by practitioners today. Most popular models today essentially leverage the persistence of price trends to predict and trade macro regimes. However, this leaves the success of one’s prediction conditional upon whether trends persist, which often is simply not the case. We recently documented an example of trend following can be a poor predictor of forward returns:
An Equity Bear Market?

This note is one typically reserved for clients of Prometheus Institutional. Occasionally, we share notes from our Prometheus Institutional to augment our retail offering here on Substack. If you are interested in access to our institutional work, you can click this link:
We think a combination of macro trends, macro mean reversion, expected returns, and fundamental economic conditions will likely offer a much better solution for estimating the probable outcome of markets. Using our proprietary tools, we can add up these fundamental and market-based tools to estimate the probability we see for tomorrow’s economic regime. We visualize this below:
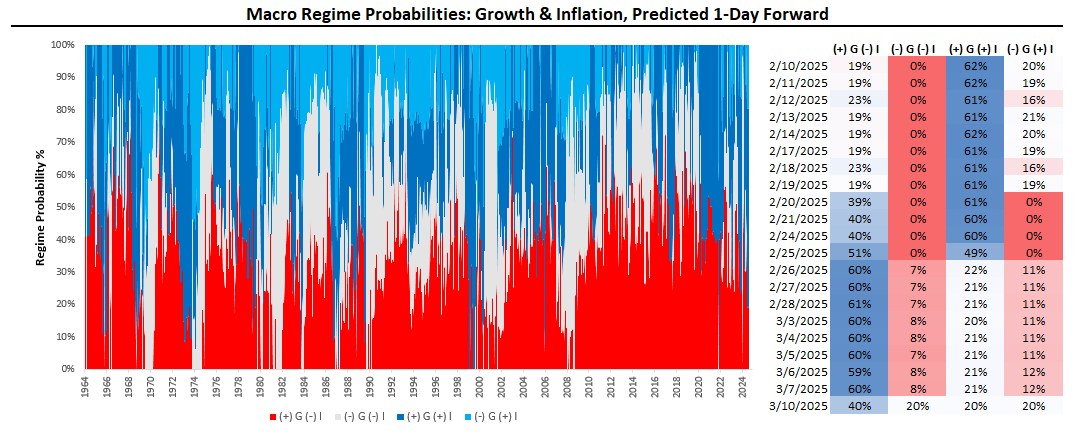
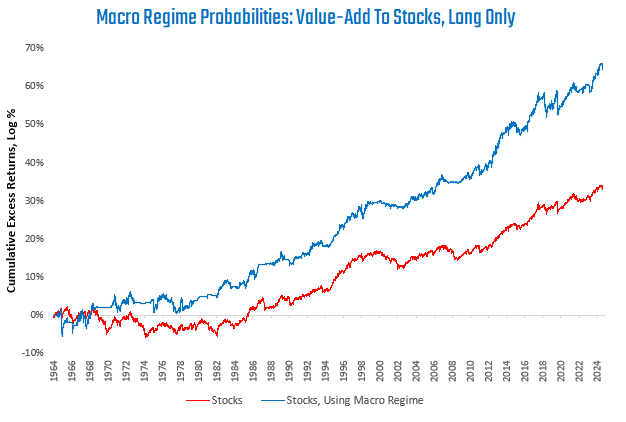
Above, we show the evolution of our Macro Regime Probabilities over time in the area chart and their recent readings in the table on the right-hand side. The readings range from 0 to 100% across all regimes. The higher the reading, the more conviction we have that tomorrow’s regime will be consistent with our expectations. Given that these regimes account for an extremely wide array of factors, they offer significant insight into investment decisions. We show how using these regimes to enter and exit stocks, bonds, and commodities can be highly beneficial to long-term performance.
We begin with stocks:
Next, we show bonds:

Finally, we turn to commodities:
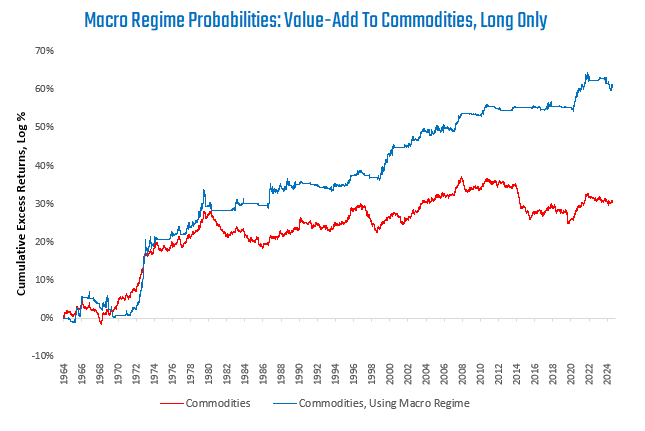
As we can see above, these regimes can be additive to long-term, long-only performance. They can help long-term performance by generating investable signals and helping investors contextualize the current macro environment by creating regime analogs. We define an analogous regime as one where the distribution of macro regime probabilities closely resembles those we see today. Using these regime probabilities, we can look at history to understand how asset markets acted when our regime expectations were similar to today's. Recall that this is how markets responded relative to our expectations for the future, not simply how they responded contemporaneously. We call these our Regime Expected Returns. We visualize the most recent readings below:
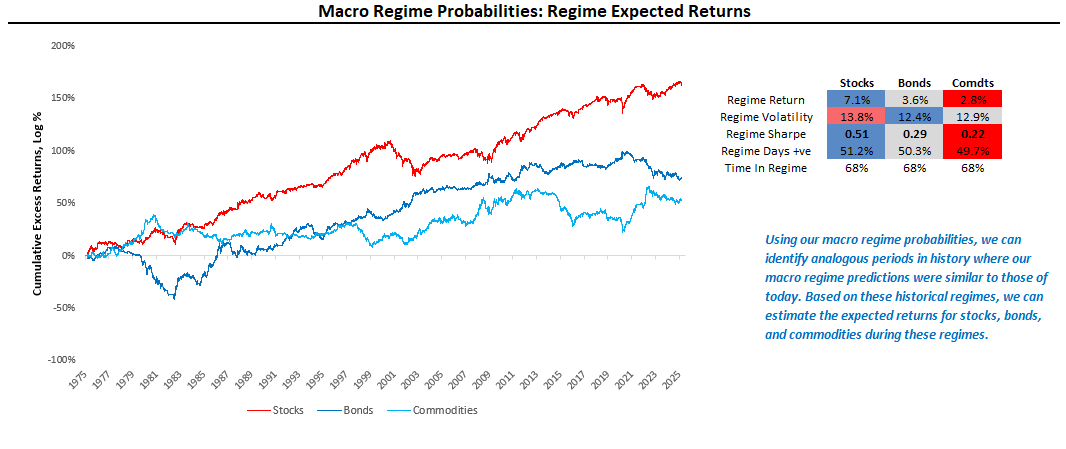
In the above visual, our systems look for instances where the distribution of regime probabilities resembles those of today's and look at how asset markets performed when we had similar expectations. Specifically, when our Macro Regimes Probabilities of (+) G (-) I, (+) G (+) I, (-) G (-) I, (-) G (+) I were around 40%, 20%, 20%, and 20%, respectively; we find that stocks, bonds, and commodities had Sharpe Ratios of 0.51, 0.29 and 0.22. More simply, stocks outperformed when we last expected this regime mix.
These visualizations (Macro Regime Probabilities and Regime Expected Returns) encapsulate hundreds of economic activity and price data measures concisely and in a manner that we leverage as investors. Given this approach's comprehensiveness and its application's simplicity, this will become the primary tool we use to manage our Prometheus ETF Portfolio. We visualize this simulated portfolio below relative to its underlying beta:
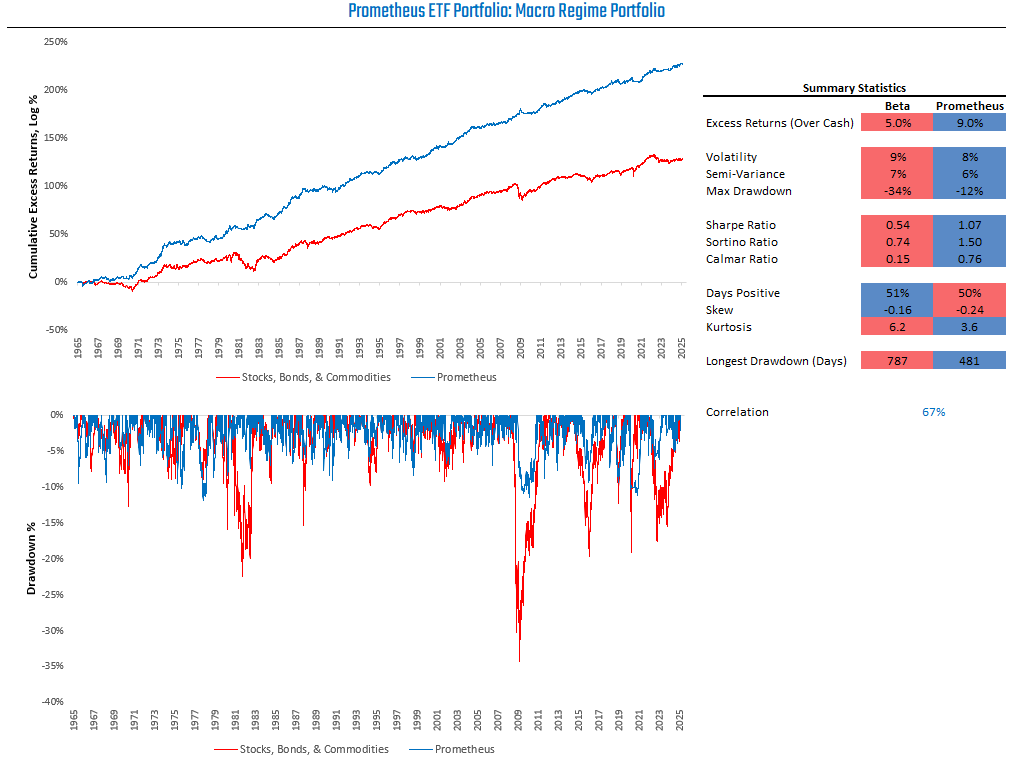
These improved and streamlined tools will boost performance while significantly increasing the ease of understanding. We look forward to sharing updated positioning based on these tools with our ETF Portfolio members.