

Today, we share our views on liquidity conditions. If you are unfamiliar with our approach to liquidity, we highly recommend reviewing our Macro Mechanics, where we outline our understanding:
What Is Liquidity?

The best information we can ever provide investors is the mechanics of how we think about macro conditions over time rather than what we think about them at any particular time.
Turning to today’s note.
Our primary takeaways are as follows:
Liquidity conditions have tightened sequentially.
Policy liquidity has begun to decline, driven by declining reserve balances and re-rating of policy rate expectations. Further, private sector liquidity is also starting to see initial signs of stress, with repo activity decelerating.
While declining liquidity broadly pressures assets, the confluence of macro conditions is likely to weigh on all assets.
Liquidity is the flow of cash and cash-like assets that potentiates economic spending. It is determined by nominal dollar values and the relative risk profile of the various sources of liquidity. We begin our tracking of liquidity conditions by sharing the weighted growth rate of the major sources of liquidity: reserves, treasury bills, commercial paper, and repurchase agreements.

As we can see above, the current liquidity dynamics are primarily driven by repo conditions after being dominated by treasury bill issuance.
We zoom on each of these components, starting with reserve balances. Reserve balances held by financial institutions at the Fed are a function of the gross liquidity supplied by the Fed through the asset side of their balance sheet relative to the gross liquidity absorbed by inflows into the liability side of their balance sheet. We visualize the asset side below:

The Fed continues to roll off its assets.
Additionally, we examine the changes in major liabilities of the Fed, i.e., the liquidity drain on the financial sector.

While the treasury general account has begun to see stabilization, reverse repo has begun to sequentially accelerated. This is a drain on reserves, which is a drain on liquidity.
Recall that when money leaves the reverse repo facility or the TGA, it returns to the financial system, thereby creating liquidity and supporting reserve balances. We can combine these perspectives to show the drivers of changes in reserve balances over time.

Between the Fed’s balance sheet roll-off and the increase of the RRP, reserves have declined, slowing the liquidity support to the financial system.
Next, we turn to the other side of government liquidity, i.e., Treasury bill supply. Much like the Fed, the treasury can impact liquidity conditions by increasing the supply of liquid assets, primarily through treasury bill issuance. We begin by showing the secular context for this liquidity supply by showing the treasury bills outstanding as a share of total treasury debt.

We remain in the highest period of treasury bill supply since the early 2000s.
To offer a more timely perspective, we examine the contribution of treasury bill growth to total treasury debt growth over time.

Bill supply continues to dominate government debt growth, and slowing bill issuance is now bringing gross debt issuance to a slower pace. This is modestly less supportive of liquidity conditions.
Now that we have looked through the primary government sources of liquidity, we can turn to the private sector. We begin with commercial paper markets. During the financial crisis, commercial paper markets were replaced by reserves as the primary receptacle to store short-term liquid assets. Nonetheless, commercial paper remains a mechanical driver of the liquidity ecosystem. We visualize the transition from commercial paper to reserves:

To further contextualize commercial paper activity, we compare the growth of commercial paper to total bank credit:

The recent growth in commercial paper relative to overall credit growth remains subdued, limiting the role of corporates in liquidity creation.
Additionally, we examine the composition of the commercial paper market, grouped into financial, nonfinancial, and asset-backed issuers. Historically, financial & asset-backed issuers have dominated commercial paper growth:
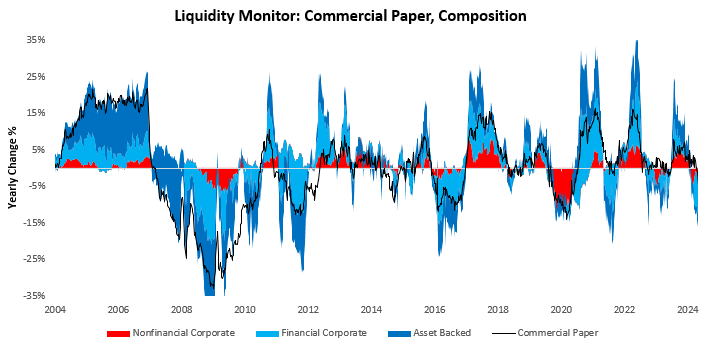
Corporate commercial paper continues to dwindle, consistent with relatively higher short-term debt service costs versus history.
While private sector activity in the form of commercial paper has dwindled, other forms of private sector activity have flourished. Particularly, repo markets have expanded to become a dominant driver of financial markets. Repo market activity is largely contingent upon the supply of collateral, particularly in the form of Treasury & MBS securities. We show the composition of repo growth below:

For a further understanding of the drivers of repo activity, we examine the volatility of the underlying collateral, i.e., the volatility of Treasury & Agency MBS. We visualize this below:

As we can see above, volatility in these crucial markets has begun to decline as a reflection of the cutting cycle. Nonetheless, repo activity has begun to slow modestly.
While collateral quality is essential to create a supportive backdrop for repo activity, we can gain a further understanding of the drivers of repo by examining the primary source of funds for repo activity - money market funds. Retail MMFs have been the primary source of funds for the recent change in repo activity. Below, we visualize the growth of money market funds, along with its composition:
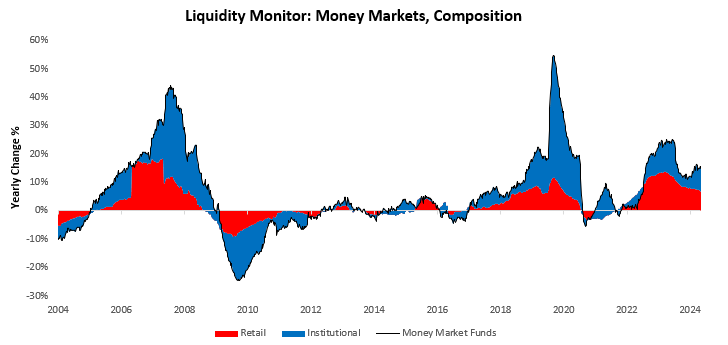
Money market funds continue to supply repo markets.
Now that we have examined all big-picture drivers of liquidity dynamics, we conclude by examining timely measures of liquidity stress in the form of short-term spreads. A widening of spreads will impact private sector credit creation and liquidity conditions. Stability in these spreads continues to support ongoing liquidity creation.

Recently, we witnessed a modest amount of stress in the form of higher SOFR spreads, reflecting seasonally tighter liquidity conditions for the financial sector.
Overall, liquidity has slowed as repo markets and reserve balances saw pullbacks towards the end of 2024. There remains very limited contagion risk for the financial system at this time. We will be watching repo markets carefully to understand whether liquidity's current slowing can become a durable contraction. For the time being, it looks unlikely. We show these dynamics reflected in our liquidity gauge below:

Until next time.