

This note is one typically reserved for clients of Prometheus Institutional. Occasionally, we share notes from our Prometheus Institutional to augment our retail offering here on Substack. If you are interested in access to our institutional work, you can click this link:
Or email us at info@prometheus-research.com.
Over the last three years, bond markets have weighed on investor portfolios, remaining in a persistent bear market. This drawdown was primarily driven by the strength of US nominal GDP relative to the expectations priced into the bond market. Today, the economy looks to be cooling relative to recent history. As such, we take stock of the drivers of bond markets to assess whether bonds can become the flight-to-safety asset they have typified for most of the modern investing era. If you’re unfamiliar with our approach to bond markets, we highly recommend reading our Macro Mechanics note, which outlines our framework:
What Drives Bond Markets?

The best information we can ever provide investors is the mechanics of how we think about macro conditions over time rather than what we think about them at any particular time.
Let's dive into today's note. Our assessment is as follows:
The Fed’s monetary tightening remains blunted by compositional changes in the economy, with nominal growth well above the current debt service burdens.
Recessionary pressures remain contained, with income, spending, sales, and employment expanding.
Relative to these conditions, treasury markets expect the Fed to cut interest rates once over the next eighteen months, suggesting little mispricing.
Systematically quantifying this picture allows us to understand whether future bond returns are likely better than in recent history. Today, monetary policy is unlikely to ease, suggesting weak returns for bond investors.
When evaluating the potential for a bond rally, we need to assess the probable path for the Federal Reserve. A cutting of policy rates drives every major bond rally. This cutting occurs when monetary policy is too restrictive. Monetary policy is too restrictive when it creates excessive interest burdens relative to current activity and weighs on future borrowing. Thus, we must assess whether current policy rates are restrictive when evaluating the prospects for a bond rally.
What determines whether current policy rates are restrictive is the degree to which the Fed changes its policy and the extent to which that policy passes through to the economy. Today, the Fed has hiked its benchmark policy rate at a pace only last seen during the 1970s. However, the transmission of that policy rate to the economy has remained muted. We visualize this below:

Above, we show the impact of changes in Fed policy rates on corporate profits via net interest expense. For instance, when the Fed hiked interest rates during the 1970s, the net interest impact on the private sector accounted for approximately a 30% hit to corporate profits at its peak. Today, despite the hike in policy rates, net interest expense for the private sector has not risen. This decreased transmission is due to two factors.
First, we have a reduction in interest-sensitive sectors as a share of total activity.

Above, we visualize the relative contributions of interest-sensitive and interest-insensitive GDP to total nominal GDP. Before 2001 (when China entered the WTO), interest-sensitive items played a much more significant role in the economy via the industrial sector. Post 2001, this industrial contribution declined significantly. Furthermore, the housing crisis in 2008 and the subsequent deleveraging resulted in a significant pullback in real estate as a share of total activity. The combination of these factors has resulted in less interest rate sensitivity for aggregate activity.
The second driver of the decline in the effectiveness of monetary policy transmission is the rebalancing of the private sector balance sheet. Particularly, in the post-2008 world, there is an increased concentration of treasuries on private sector balance sheets as a share of total outstanding debt. We visualize this below:

While this increases total debt to GDP, it ameliorates corporation’s net interest burdens. Corporate net interest burdens are a function of the private sector’s gross interest expense, less the gross interest income earned. The US treasury plays a disproportionate role in determining net interest expense. This disproportionate role is because, unlike the private sector, where there are significant balance sheet overlaps that cancel each other out, all treasury interest payments result in interest income to the private sector. As such, when the treasury makes large interest payments, they significantly offset gross interest expenses. This dynamic dominates today’s balance sheets, where the treasury pays large sums of interest on its outstanding debt. We visualize the impact on nominal GDP from these channels below:

Above, we visualize private sector interest burdens in red, which drag corporate profits. Additionally, we visualize public sector interest benefits in blue, which boosts profits. Monetary policy is restrictive when the private sector interest burdens are above the public sector interest benefit. Today, we see the opposite: private-sector interest burdens are below the public-sector interest benefit, indicating that monetary policy is marginally accommodative.
Thus, a decline in the share of activity from interest rate-sensitive sectors has blunted the extent to which interest rate policy impacts gross interest expense as a share of activity. Additionally, the recomposition of private sector balance sheets has significantly increased public sector interest benefits. The combination of these conditions has significantly reduced the effectiveness of monetary policy transmission. Our timely reads suggest these dynamics persist:

With this limited monetary policy transmission, interest burdens remain well below the pace of nominal activity.

Thus, with the pace of nominal GDP well above current interest burdens and policy rates now easing rather than tightening further, it is unlikely that interest rates alone can cause the Fed to be restrictive.
While this accommodative stance is true for the broad economy, this is not necessarily true for every sector. However, the Fed does not respond to sector-specific challenges and assesses the economic picture on an aggregated basis. Given the limited transmission of monetary policy to current interest burdens, the only way policy is likely to become restrictive is if current activity declines significantly and persistently. Said differently, the most probable path to any monetary easing from here will be through a recession. Currently, we see that as unlikely.
For further insight into whether GDP conditions are consistent with recessionary pressures, we aggregate macroeconomic indicators, consistent with the NBER methodology of recession classification, into a recession probability monitor. This gauge gives us a real-time understanding of developing recessionary pressures. Currently, recession probabilities are at 24%:

While this is not necessarily a forward-looking measure of economic activity, policy will respond to ongoing economic conditions rather than forecasted ones, particularly when it comes to easing significantly.
For a deeper understanding, we examine the major determinants of recession, i.e., employment, sales, production, income, and spending. We begin with timely reads of the labor market.
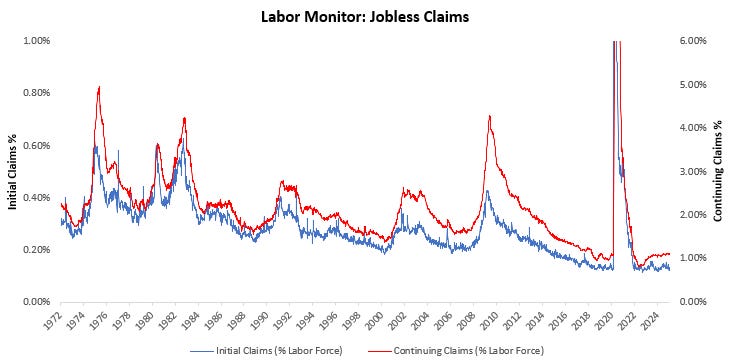
Jobless claims rates continue to remain benign. Next, we turn to business sales.

Manufacturing and trade sales have rebounded on the back of strong retail sales. We now turn to industrial production and capacity:

Industrial activity continues to remain in a downturn, increasing recession probabilities modestly. Next, we turn to incomes in the form of wages:
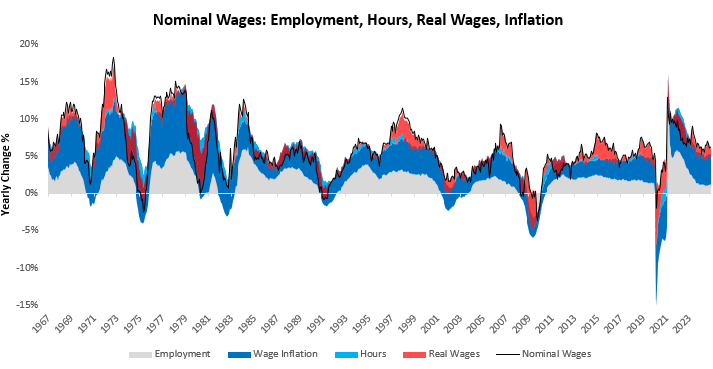
Nomial wages remain elevated versus recent history. Real wages remain stable. Finally, we show how these wages are translating into spending:

Strong sales, employment, and wages continue to power pervasive strength in spending.
Thus, examining the major determinants of a recession—sales, employment, production, incomes, and spending—there remain few indications of an imminent recession. As such, it is highly unlikely that policymakers will embark on a cutting cycle of meaningful magnitude based on economic activity.
We think investors must recognize that barring a significant cutting cycle by the Fed; there is little room for yields to decline meaningfully. Treasury yields reflect changes in monetary policy expectations. Either policy moves more than markets expect, or market expectations move ahead of policy. Said differently, either monetary policy can ease, or expectations can ease. Both of these easings result in bull market conditions for bonds. Today, we think it is unlikely that the constellation of economic data can move policymakers to ease policy rates meaningfully. Therefore, the question is whether we can have a market-based easing rather than a policy-based easing.
We can look through history to see how often this type of dynamic has existed and if it can offer meaningful returns to bond investors:

Above, we show the cumulative returns during two distinct regimes. The first, illustrated in blue, is when policy rates are easing. The second is when policy rates are stable, but expectations are easing. Effectively, these two regimes capture policy-based easing and market-based easing, respectively. What is crucial to note is that market-based easing is extremely fleeting and offers few opportunities to bet on effectively. In contrast, correctly betting on easing offers significant and consistent returns. In essence, a bet on lower bond yield requires policymakers to act.
Today, we see little pressure on policymakers to move decisively on monetary policy. Given that most bond returns are driven by policy easing, this offers little opportunity to investors looking to enter long bond exposures. There may be room to tactically trade a growth scare, which would lower policy expectations. However, as illustrated above, the opportunity set for such trades is quite limited. Overall, the outlook for bonds remains weak.
We can quantify this weakness using our systematic tools. To illustrate how these dynamics impact bond markets, we can use our programmatic understanding of economic conditions to create two backdrops: one where monetary policy is likely to ease in the near future and the other when it is likely to stay flat.
Based on these probable easing paths, we can then create two portfolios. The first buys bonds when monetary policy is likely to ease. The second buys bonds when monetary policy is likely to stay flat. We visualize this below:

As visualized above, virtually all the gains on treasury bonds come from when monetary policy is likely to ease. Buying bonds when monetary policy is likely to ease results in a Sharpe Ratio of 0.76. Meanwhile, buying bonds when monetary policy is likely to stay flat results in a Sharpe Ratio of 0.17. Today, blunted monetary policy transmission, elevated nominal activity, and low recession probabilities make it unlikely that monetary policy will ease. As such, bonds are likely to have muted returns at best.
Until next time.
This is gold. BTW, are you hinting that the declining share of interest sensitive components of GDP is primarily attributed to the manufacturing offshoring?