

Bonds are off to a rocky start for 2026. We take stock of what’s priced into bond markets relative to systematic measures to form an outlook for US treasuries.
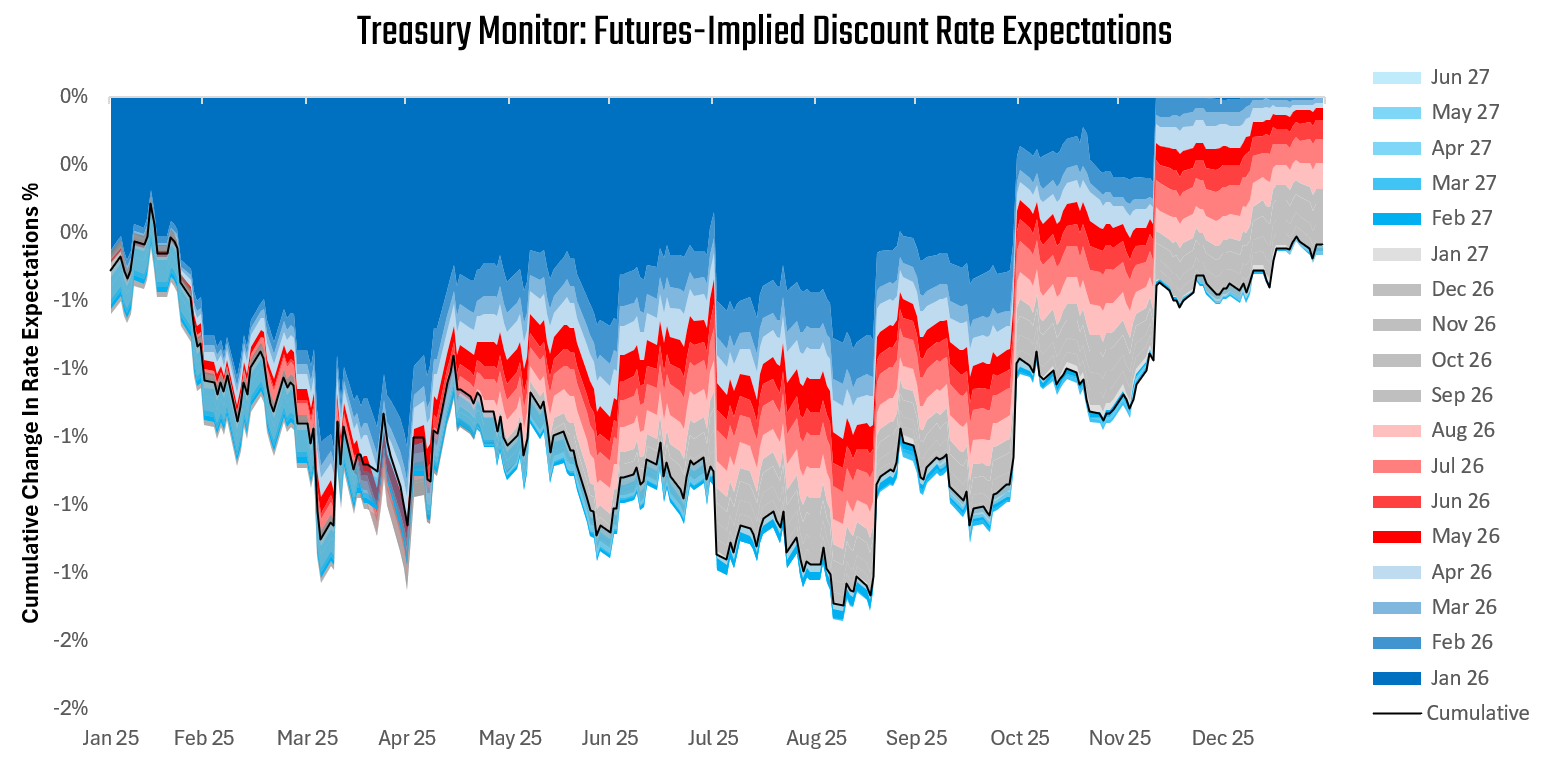
Mathematically, the single biggest factor that impacts nominal bonds is changes in discount rate expectations. Over the last month, short-term interest rate markets have remained unchanged. Over the last year, these markets have remained unchanged. We show the evolution of these expectations below:
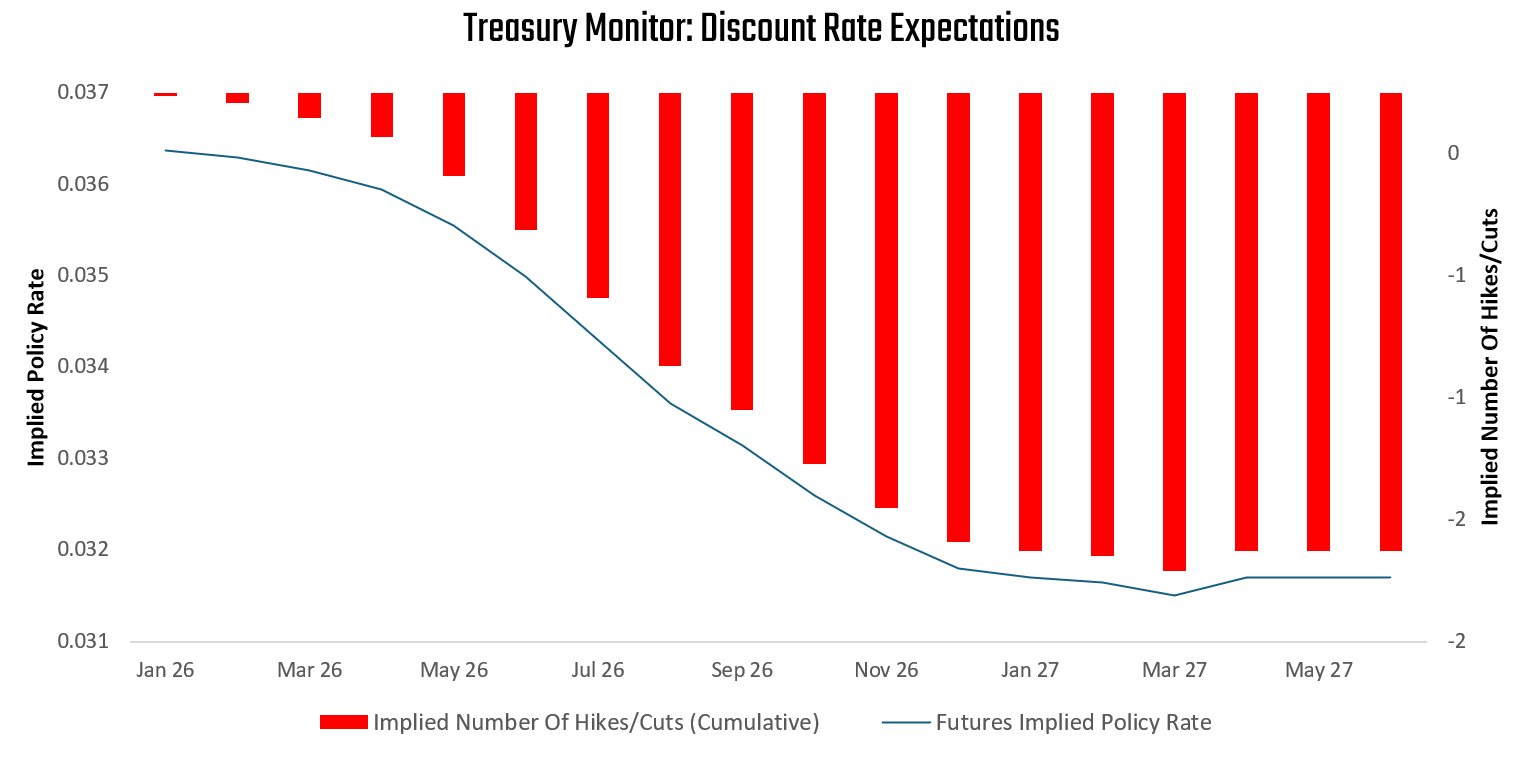
To better contextualize these recent changes in policy expectations, we show the latest discount rate path priced over the next eighteen months. Short-term interest rate markets are expecting a peak in policy rates on Feb 26 at 3.64%, followed by a trough on Jan 2027 at 3.18%. This implies approximately 2 interest rate cuts cumulatively over the next eighteen months. We show this path below:
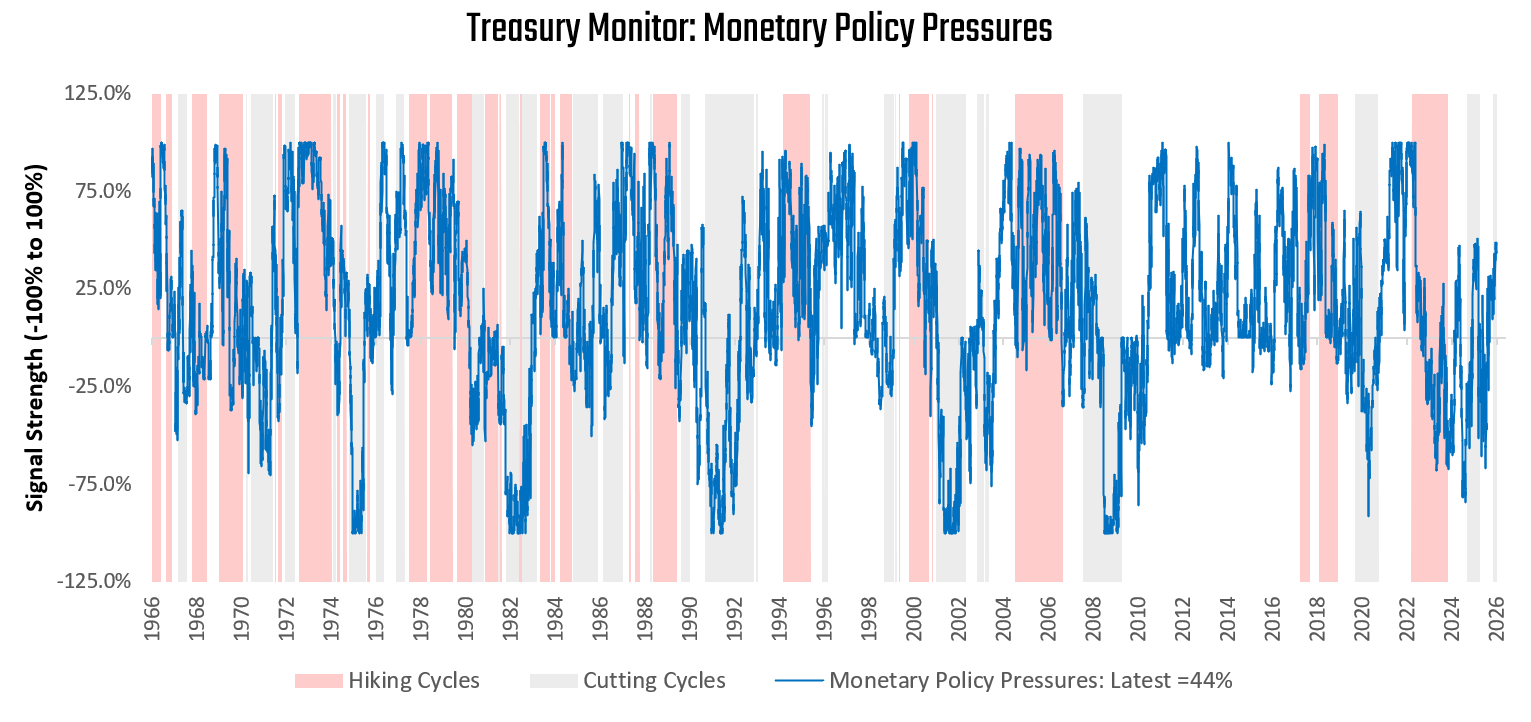
These cuts are directionally inconsistent with the latest readings from our monetary policy pressures gauge. Our monetary policy gauge measures the pressures on the Federal Reserve to move monetary policy, based on the trade-off between growth and inflation data. The higher our readings, the greater the pressure to hike policy rates. The lower the gauge, the more pressure there is to cut policy rates:
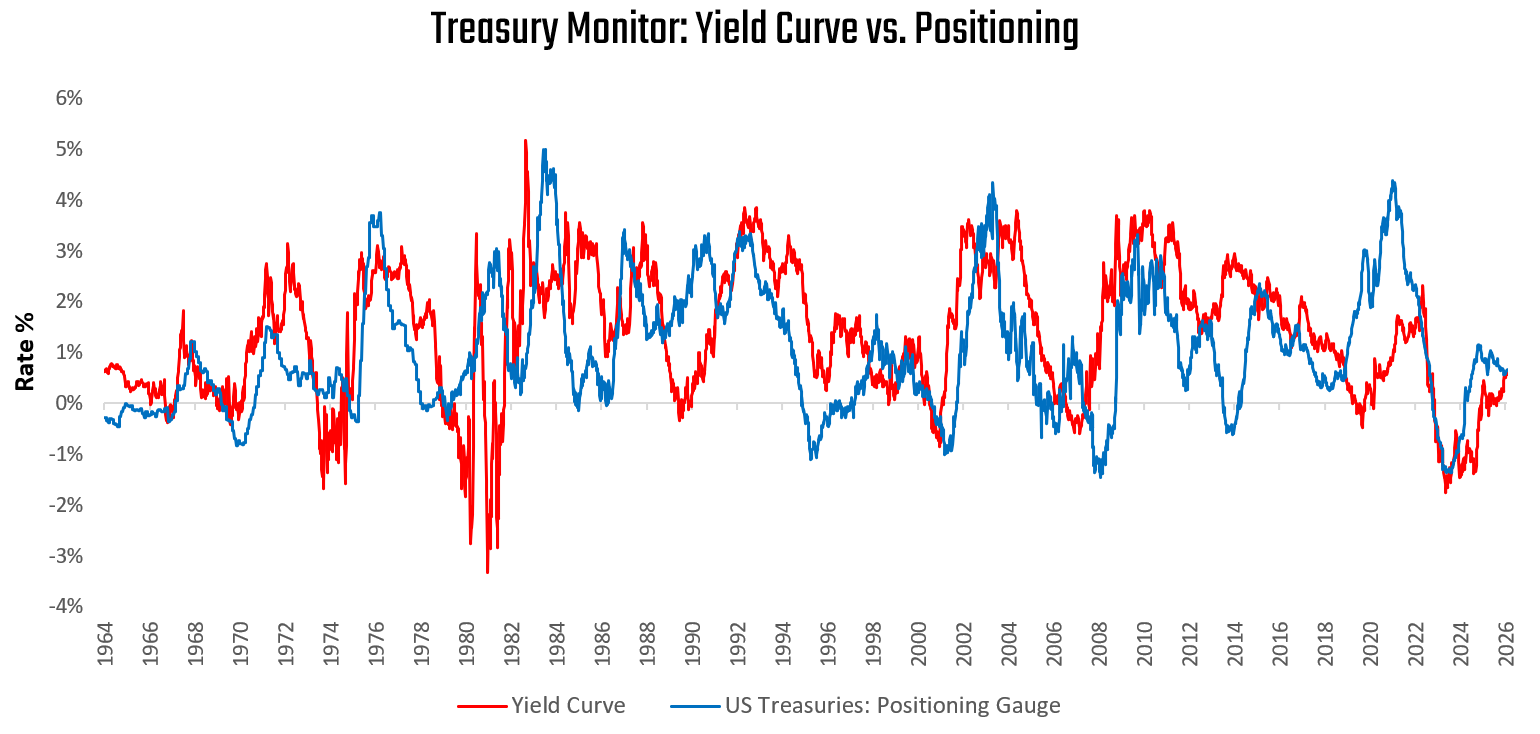
Having examined the pricing of discount rates, we turn to the shape of the yield curve. We compare the curve to positioning to assess bond attractiveness. When the curve offers more carry than positioning reflects, positioning typically catches up via increased duration exposure. When positioning exceeds what the curve justifies, trades become crowded and vulnerable to reversal. Currently, US yield curves show modest vulnerabilities for 10-year Treasuries:
These measures reflect two independent views on US Treasuries: a policy view, which can be expressed in the short end of the treasury curve, and a positioning bet, which can be reflected in the long end of the curve. We show how these views are mechanically and empirically uncorrelated:
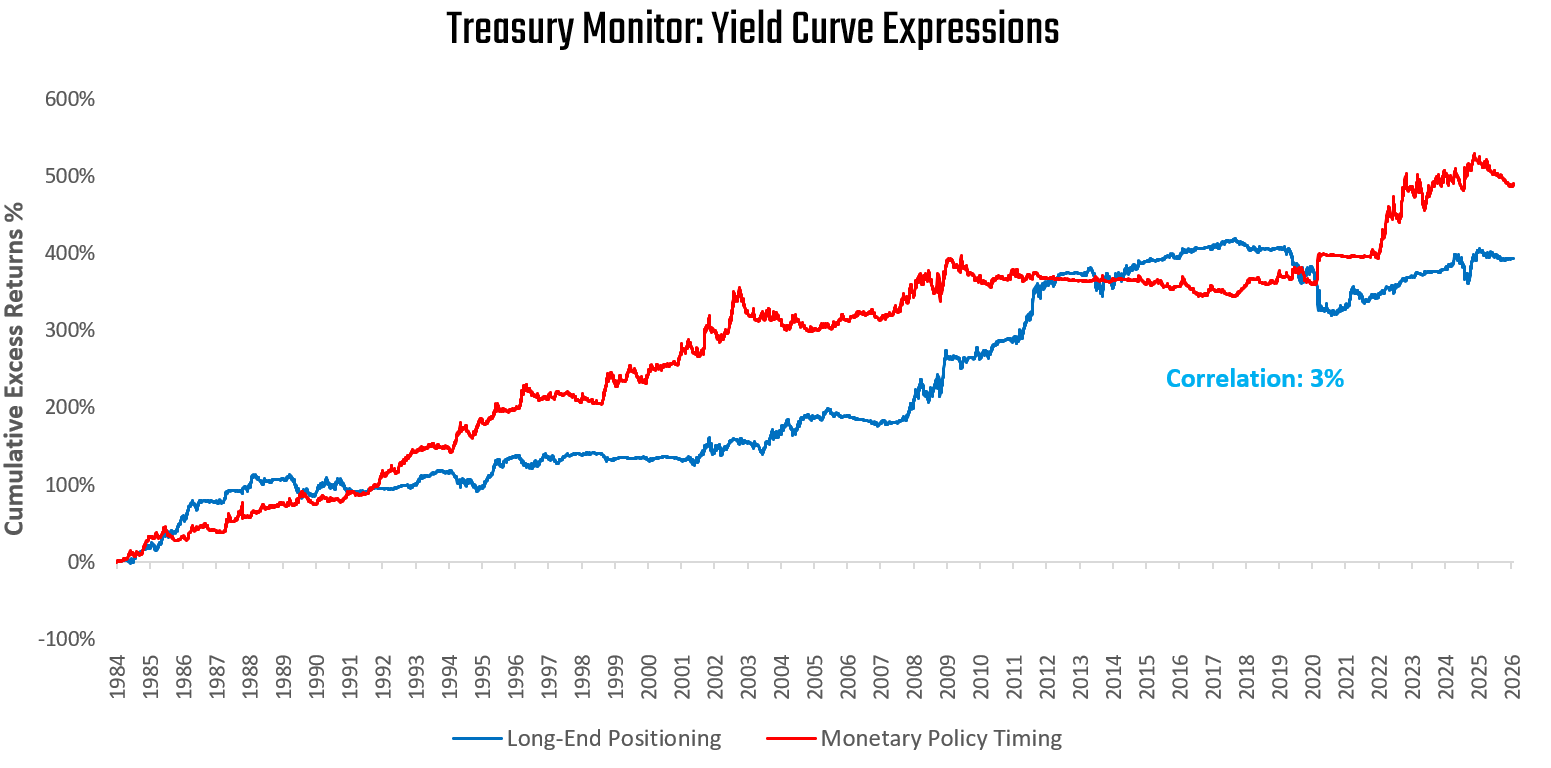
Further, given that these independent views are effectively isolated views on bond yields, they can be combined for a comprehensive view on US Treasuries:
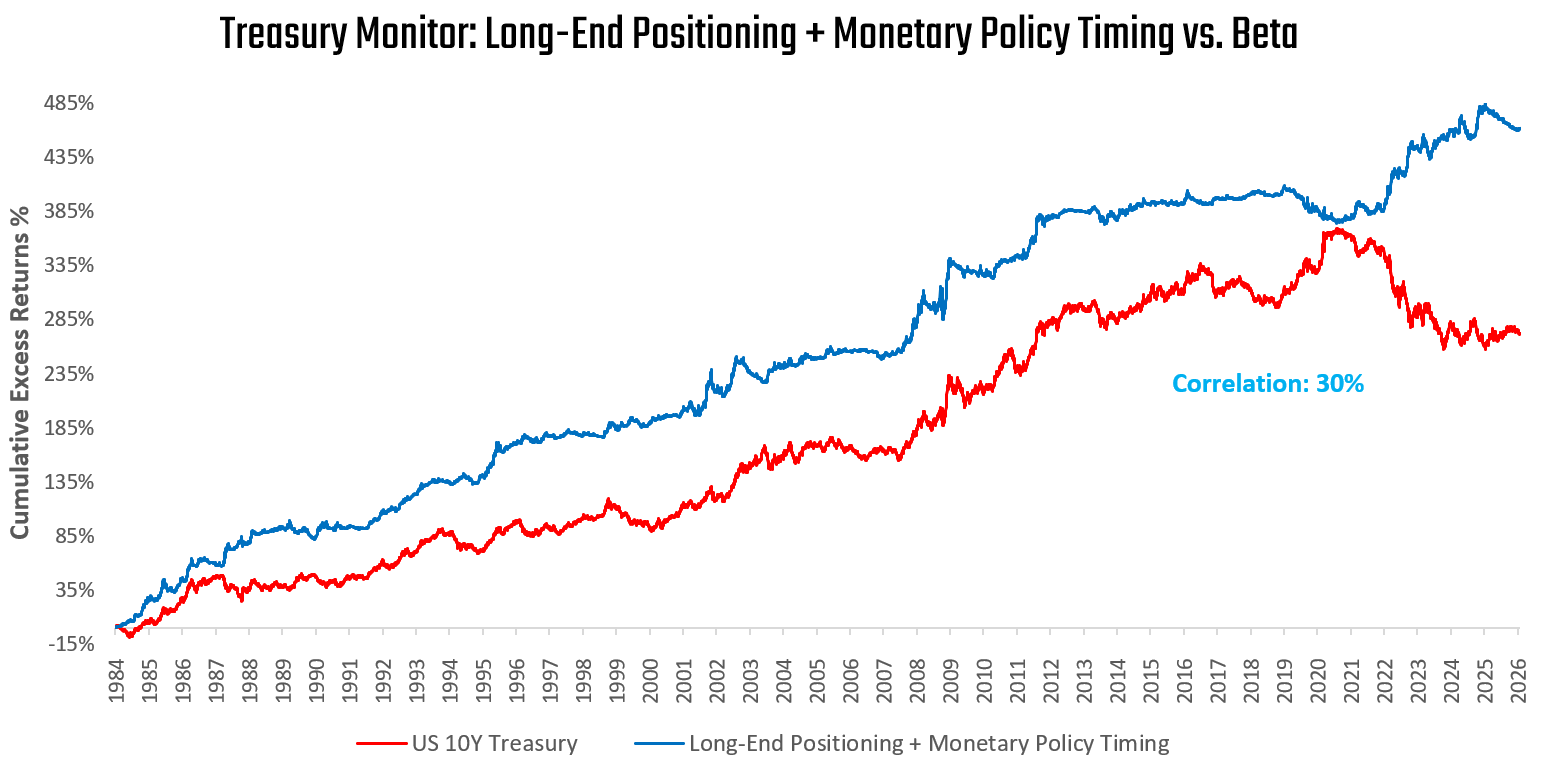
Currently, these measures suggest marginal downside pressure on Treasuries from positioning; however, the pressure on policy rates to rise from strong economic activity remains meaningful. Headwinds for Treasuries persist.
If you’re looking for a process that applies these insights and more to investable portfolios, we recommend checking out the Prometheus Menu. From beta management to macro alpha, we have a wide variety of solutions for all investors:
The Prometheus Menu

Welcome to the thousands of you who have subscribed over the last few weeks. Over the last year, our process and offering have grown tremendously. We provide a short guide to everything available to subscribers here, both free and paid.
Until next time.
Excellent note.
I don’t know about pricing but I can assure you holding bonds long term / or any formula is not gonna save your returns
https://jarviscapitalresearch.substack.com/p/proof-of-work-why-5-years-is-the?r=6qs9m8