The Prometheus Asset Allocation program offers a stable, macro-focused approach to asset management. Prometheus Asset Allocation aims to outperform a traditional stock and bond portfolio by leveraging our proprietary systematic macro process to rotate between 3 ETFs monthly.
The latest CPI data surprised consensus expectations and drove an acceleration in the three-month inflation trend. This print was dominated by energy inflation, particularly motor fuel and gas prices.
Macro pressures continue to show potential for inflation in aggregate nominal spending; however, labor markets and production have begun to see significantly lower inflationary pressures.
While the constellation of these factors points to neutral inflation, current headline dynamics pose significant pressures to the Fed’s policy to ease monetary policy conditions.
In the context of markets, neutral inflationary pressures are a significant headwind bonds. This is reflected in our Prometheus Asset Allocation Strategy.
In December, headline CPI came in at 0.39%, disappointing consensus expectations of 0.4%. Core CPI contributed 0.18% to this print, with food & energy contributing the remaining 0.21%. This print drove an acceleration in the three-month trend. Below, we display the sequential evolution of the data:
The primary drivers of CPI inflation are food, energy, transport, and shelter. These components have contributed 0.04% (Food), 0.17% (Energy), 0.07% (Transport), and 0.09% (Shelter), respectively. We display these contributions to the 0.39% change in CPI below:
For further perspective, we show how these areas have accounted for the majority of variation in inflation both economically and statistically. Over the last year, food, energy, transport, and housing have contributed 0.33% (Food), -0.03% (Energy), 0.39% (Transport), and 1.66% (Shelter), respectively, to the change in inflation. We display these principal drivers of inflation over time below:
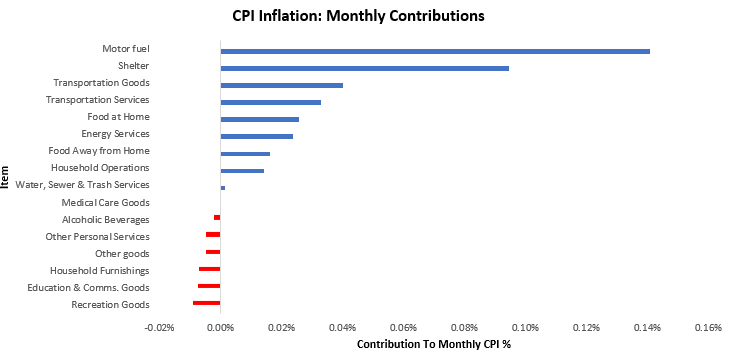
We now zoom back into the most recent print. Inflation was somewhat mixed with Motor fuel contributing most positively, and Recreation Goods contributing most to weakness. We display the largest movers to the upside and downside below:
We now zoom into our major categories of food, energy, transport, and shelter. We begin with food. The most recent data showed that food inflation was largely positive, with cereals and bakery products showing the most relative strength and nonalcoholic beverages and beverage materials showing the most weakness.


