Welcome to The Observatory. The Observatory is how we at Prometheus monitor the evolution of the economy and financial markets in real time. The insights provided here are slivers of our research process that are integrated algorithmically into our systems to create rules-based portfolios.
Our observations are as follows:
The latest CPI data disappointed consensus expectations and drove a deceleration in the three-month inflation trend. This print was dominated by energy and transportation.
Energy category, especially motor fuel, was the primary drag. Transportation inflation decreased with falling used vehicle prices. Furthermore, housing inflation continued to slow, consistent with declining nominal activity in the sector.
Zooming out, nominal spending remains elevated relative to debt service costs. However, weak industrial production complemented by a modestly looser labor market continues to dampen inflation pressure.
Overall, the Fed will only cut rates based on a durable downward trend in inflation. While this is a positive beginning, we are still a ways off from the Fed’s policy target.
In the context of markets, neutral inflationary pressures are a headwind for bonds. This is reflected in our Prometheus Asset Allocation Strategy.
In March, headline CPI came in at -0.05 %, disappointing consensus expectations of 0.1%. Core CPI contributed 0.05% to this print, with food & energy contributing the remaining -0.1%. This print drove a deceleration in the three-month trend. Below, we display the sequential evolution of the data:
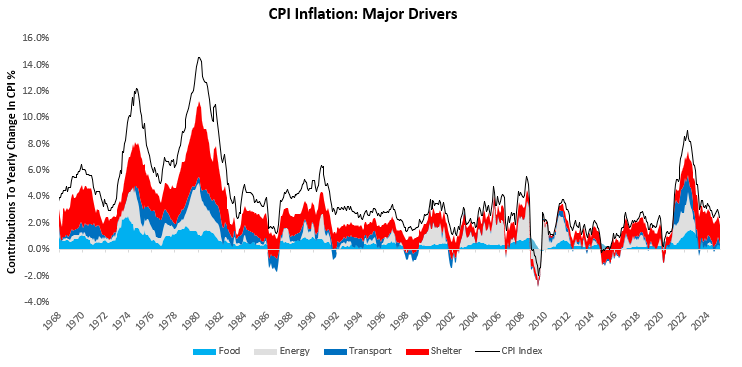
The primary drivers of CPI inflation are food, energy, transport, and shelter. These components have contributed 0.06% (Food), -0.14% (Energy), -0.1% (Transport), and 0.08% (Shelter), respectively. We display these contributions to the -0.05% change in CPI below:
For further perspective, we show how these areas have accounted for the majority of variation in inflation both economically and statistically. Over the last year, food, energy, transport, and housing have contributed 0.4% (Food), -0.22% (Energy), 0.23% (Transport), and 1.43% (Shelter), respectively, to the change in inflation. We display these principal drivers of inflation over time below:


