

Welcome to Prometheus Asset Allocation. The Prometheus Asset Allocation program offers a stable, macro-focused approach to asset management. Prometheus Asset Allocation aims to outperform a traditional stock and bond portfolio by leveraging our proprietary systematic macro process to rotate between 3 ETFs monthly (plus cash). As part of the program, we will be sharing our views on Growth, Inflation, and Liquidity in addition to our monthly video updates.
Our observations are as follows:
Timely readings of GDP growth have declined significantly in recent months, but trade data distortions are driving this weakness. After adjusting for these distortions, we continue to find GDP growth expanding at a modest pace.
Looking across economic data, our systems see favorable domestic conditions, an expanding business cycle, and positive earnings expectations pressures.
The combination of these dynamics supports stocks and commodities over bonds.
Our Asset Allocation Program avoided losses in equities and bonds this month as the program recognized the weak expected return profiles in both assets. The current constellation of growth conditions makes our systems more inclined to add back equity exposure than otherwise.
Let us dive into the data driving this assessment.
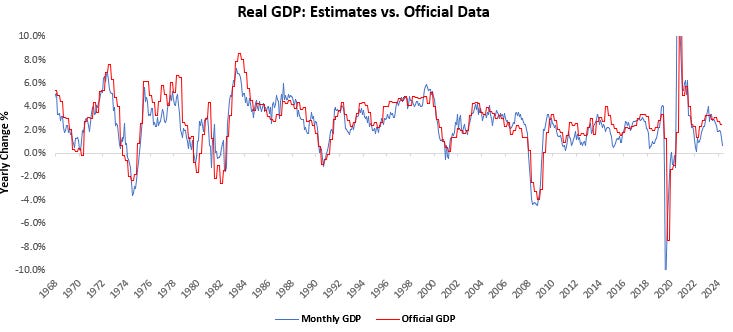
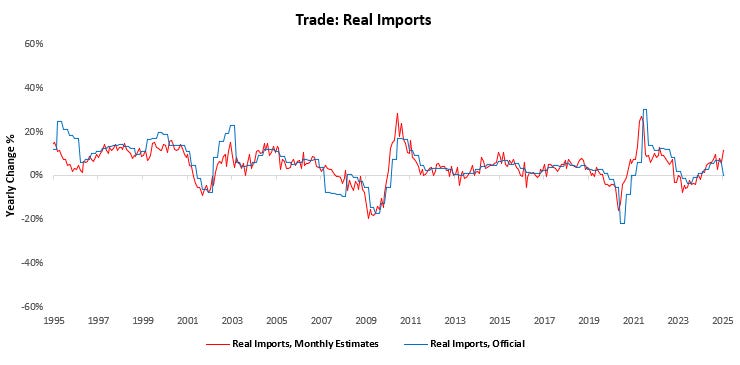
The latest timely reads of economic data have placed GDP in contractionary territory. In particular, trade data has shown significant volatility and negatively, dragging down GDP estimates. Below, we show how real GDP, unadjusted for the technical nuances of the recent data, has pushed our estimates into contraction:
While this number may look alarming at the surface level, almost all the weakness came from increased import activity. Excluding trade, GDP growth is at a healthy 1.7% versus the one-year prior.
All of the drag to the headline GDP numbers is coming from volatile trade inputs. In January, U.S. imports of nonmonetary gold surged from $13.2 billion in December to $32.6 billion. This accounted for nearly 60% of the widening goods trade deficit, which resulted in the downward pressures on implied GDP growth. However, it's important to note that the Bureau of Economic Analysis (BEA) typically excludes gold from GDP calculations because gold functions primarily as a financial asset rather than a consumable good or service. We visualize how good imports were overstated mainly due to these outsized gold import numbers:
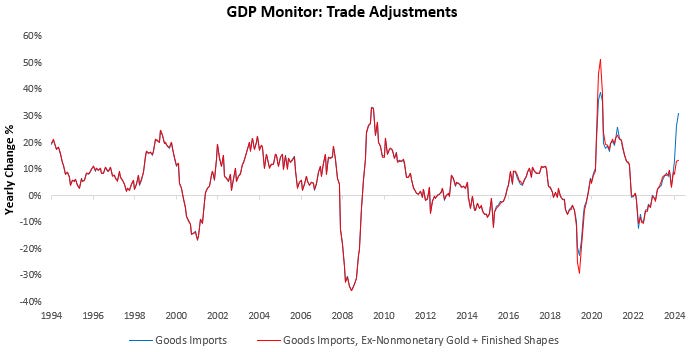
As such, while the goods trade balance may indicate weakness in GDP, it is unlikely to enter the official statistics. This outcome is consistent with intuition; financial asset flows are not economic output.
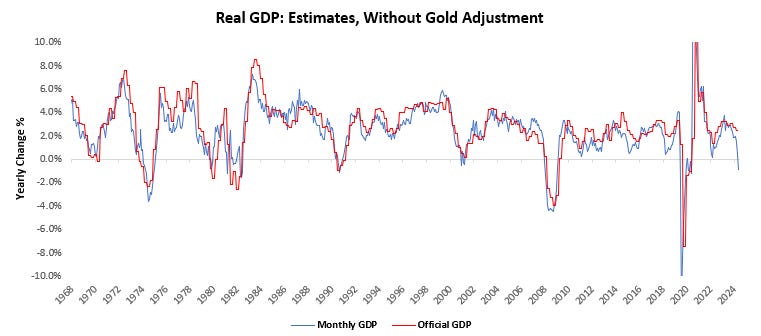
Adjusting our GDP estimates to strip out the effect of gold imports, we find that picture to be more positive:
After accounting for these trade-based anomalies, our systems have placed Real GDP growth at 0.65% compared to the previous year. We dive into the composition driving this print.
In February, GDP came in at -0.34% versus the prior month. Below, we show the weighted contributions to the most recent one-month change in real GDP, along with the recent history of month-on-month GDP. Addtionally, we show the contribution by sector to monthly GDP in the table below:
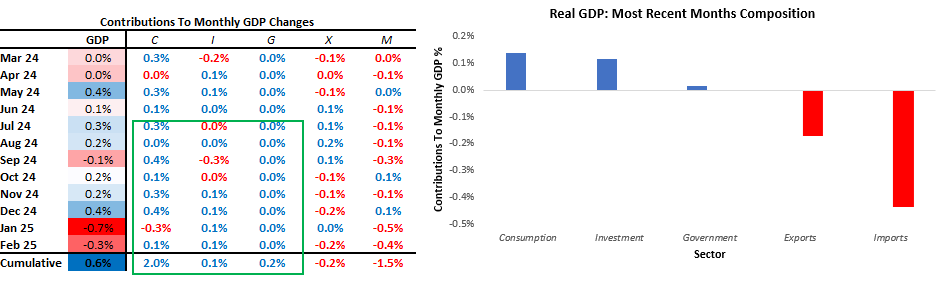
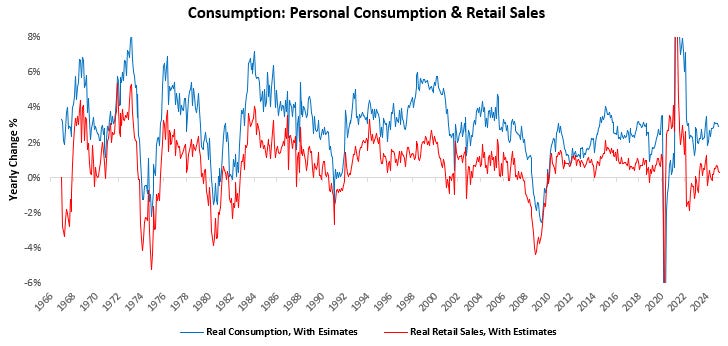
In February, real consumption spending increased by 0.14%. Over the last year, consumption has added 2.01% to GDP growth of 0.65%.
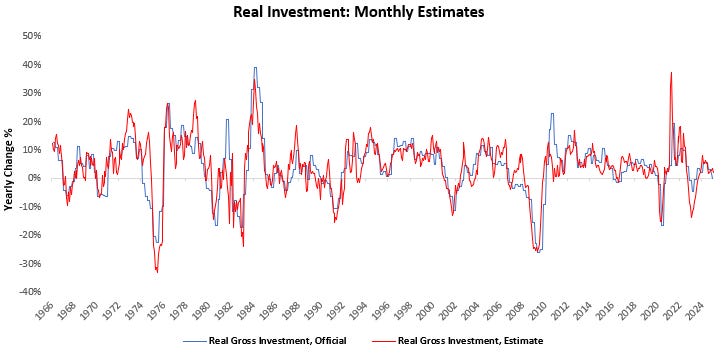
In February, real gross investment increased by 0.12%. Over the last year, investment has added 0.12% to GDP growth of 0.65%.
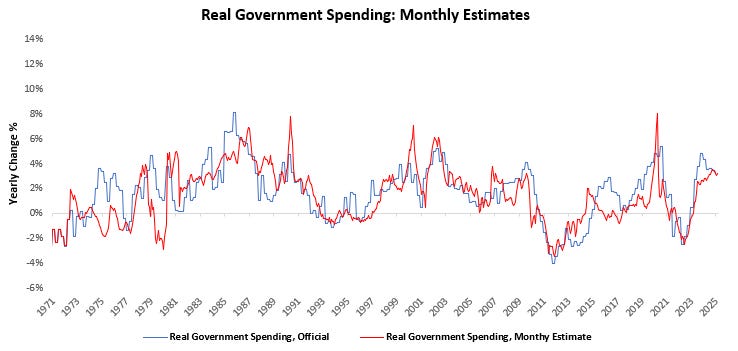
In February, real government expenditures increased by 0.01%. Over the last year, government spending has added 0.23% to GDP growth of 0.65%.
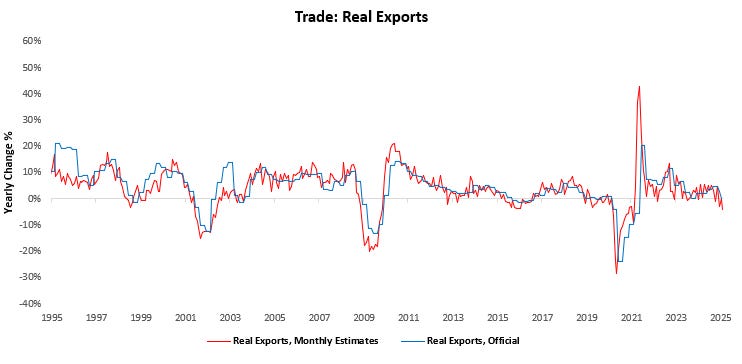
In February, real export revenues decreased by -0.17%. Over the last year, exports have subtracted -0.24% from GDP growth of 0.65%.
In February, real import expenditures decreased by -0.44%. Over the last year, imports have subtracted -1.47% from GDP growth of 0.65%.
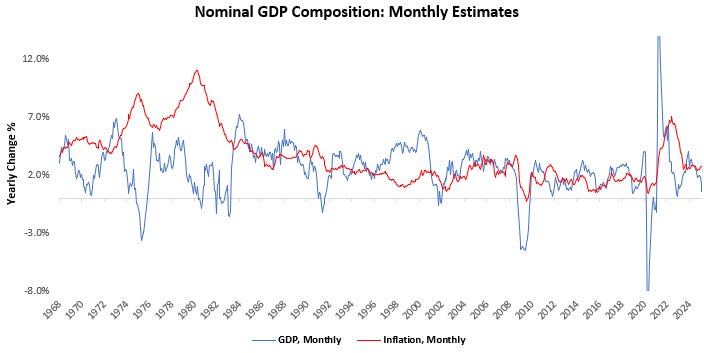
Additionally, we show the composition of monthly estimates of nominal GDP, broken into real GDP growth and inflation. Our latest estimates place nominal GDP at 3.39% versus one year prior, with real GDP growth of 0.65% and inflation of 2.74%:
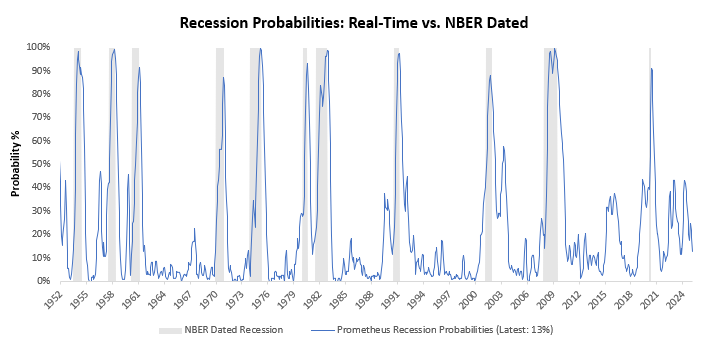
For further insight into whether GDP conditions are consistent with recessionary pressures, we aggregate macroeconomic indicators, consistent with the NBER methodology of recession classification, into a recession probability monitor. This gauge gives us a real-time understanding of developing recessionary pressures. Currently, recession probabilities are at 13%:
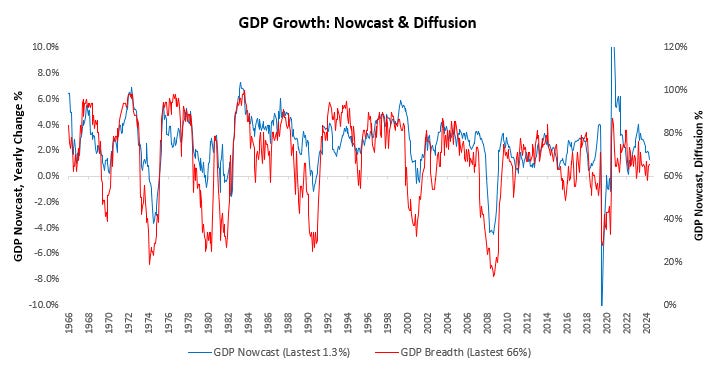
Finally, we zoom out to offer what the mosaic of economic data say about the pervasiveness of GDP growth for the breadth of the latest data available through January. Our GDP Nowcast economic data across 75 measures of real growth conditions to understand the economic conditions in a timely manner. We share both the current level of the nowcast in blue, along with a diffusion index of the underlying components in red. Currently, 66% of subcomponents are rising, consistent with an expansion:
Below, we visualize the prospective paths of real GDP growth over the next twelve months using our data trajectory monitor. We share two processes. First, we extrapolate the current trend in the data to visualize the prospective trajectory of GDP based on the current trend. Additionally, we share our forward-looking estimates for real GDP growth based on our proprietary process:
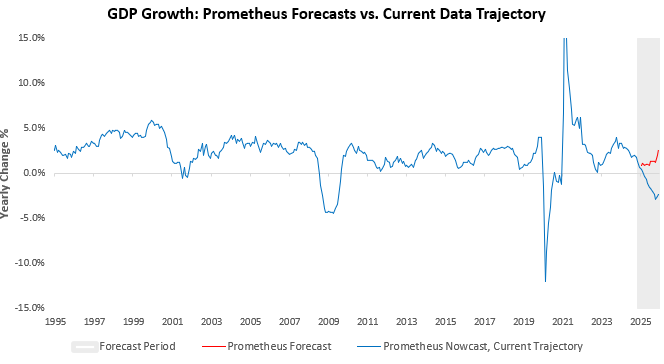
As we can see above, our forward-looking estimates are looking through the recent weakness in economic activity and projecting a rebound in output.
This positive outlook is corroborated by the latest readings from our Business Cycle Monitor. The business cycle is the cyclical variation of economic growth over time, driven by changes in business investment. These changes in business investment are a function of current and expected income, which determine output and employment. Extremes in business cycle conditions create serial correlations in the economy and markets. Extremely strong business cycle conditions result in inflation, while extreme weakness in business cycles results in recession. These extreme environments are highly influential on market trends. As such, we think a consistent, comprehensive, and timely assessment of these dynamics is key to navigating market cycles. Combining the data on business investment, capital-intensive output, labor conditions, and their underlying trends, we can create a forward-looking estimate for GDP growth. The purpose of this estimate is not to be extremely precise on future GDP growth but rather to give us early indications of when we may enter into a business cycle downturn while still offering some forward-looking insight into its prospective GDP impact. We visualize this below:
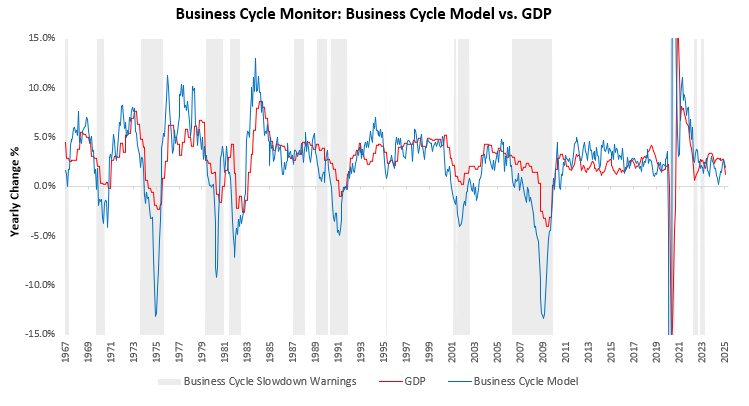
Our Business Cycle Model continues to show positive readings. We can use these insights to get a better understanding of current earnings expectations for the equity market as well.
Equity prices over time are determined by changes in earnings expectations. As such, carefully monitoring changes in the drivers of earnings expectations can give us insights into the price pressures at play in equity markets. Earnings expectations are driven by a combination of financial conditions and fundamental macro forces. Combining these measures, we create a timely gauge of earnings expectations. We visualize this below:
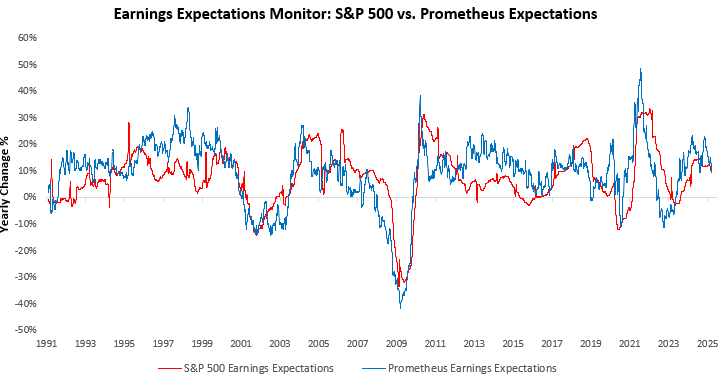
As we can see, our gauges have offered a timely and leading insight into cyclical changes in earnings expectations. Today, S&P 500 earnings expectations are minimally above our estimates.
Thus, while measures of equity trends have deteriorated meaningfully, our systems continue to suggest that equities and commodities will be supported by a positive nominal and real growth backdrop. Whether or not our systems choose to reallocate to equities remains to be seen. The move to avoid both stocks and bonds in March proved to be an additive one. As always, we will provide new Asset Allocation positions at the beginning of the coming month.
Until next time.