

Welcome to Prometheus Asset Allocation. The Prometheus Asset Allocation program offers a stable, macro-focused approach to asset management. Prometheus Asset Allocation aims to outperform a traditional stock and bond portfolio by leveraging our proprietary systematic macro process to rotate between 3 ETFs monthly (plus cash). As part of the program, we will be sharing our views on Growth, Inflation, and Liquidity in addition to our monthly video updates.
Our primary takeaways are as follows:
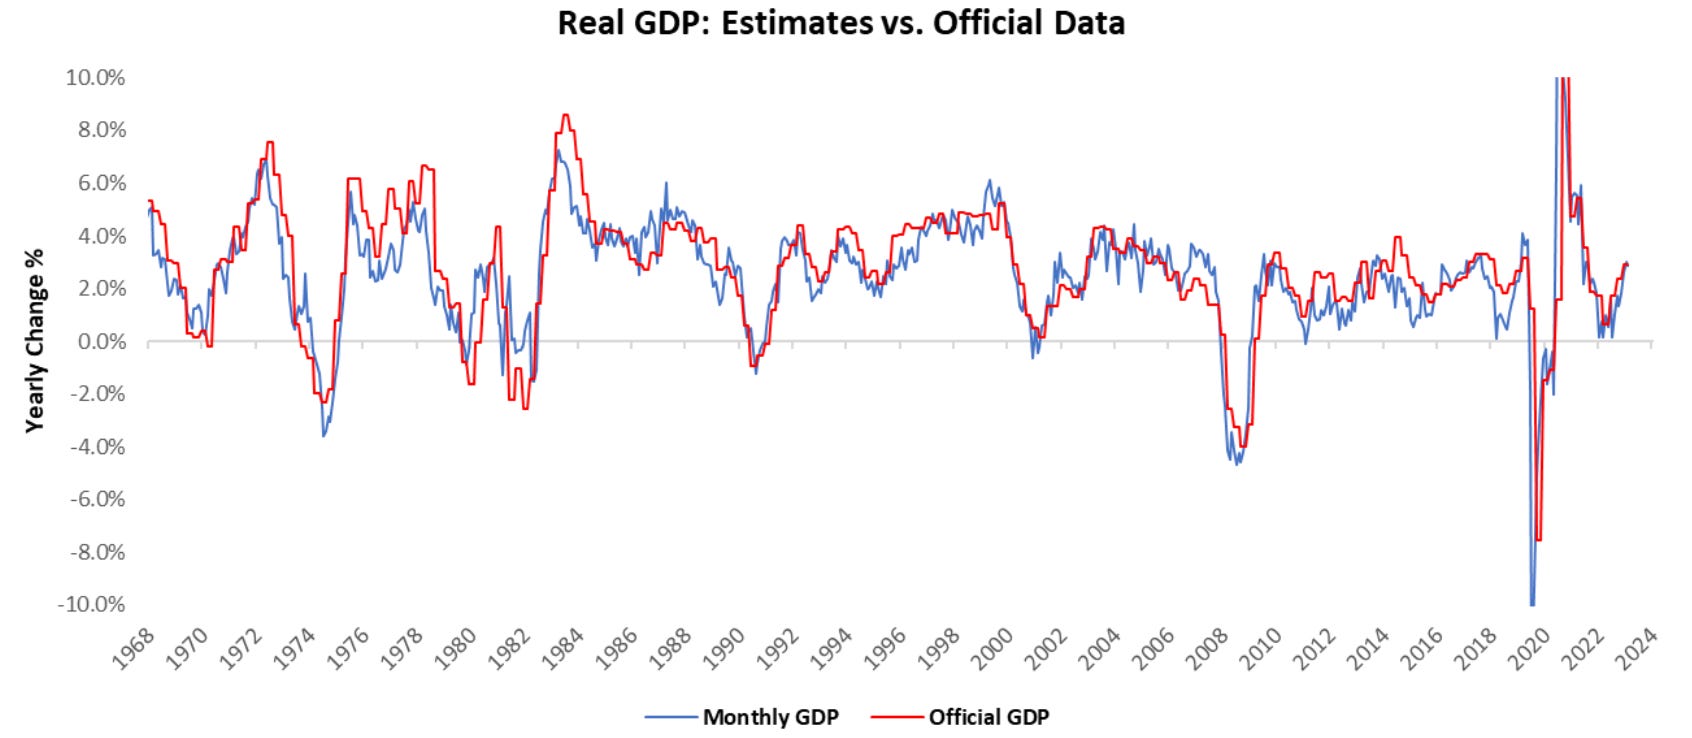
For the latest data through June, our systems place Real GDP growth at 2.26% versus one year prior, driven primarily by a sequential acceleration in Consumption and Government Expenditure.
Manufacturing spending remains weak relative to the broader economy and is unlikely to exit this weakness soon. However, the weakness is not durable enough to drive the entire economy into recession.
Overall, the business cycle conditions suggest that the US economy has moved from a cyclical reacceleration to a regime of Slowing but Growing. Our Asset Allocation strategy remains long equities and modestly long bonds and commodities.
The Fed has tightened monetary policy to levels not seen in decades; quantitative easing has been removed from markets. Yet, the economy has shown robust nominal growth, equity markets have risen to all-time highs, and bonds have struggled to post durable performance. This set of circumstances is largely inconsistent with the archetypical progression of business cycles. Thus, we need to consider as forward-looking investors whether this archetypical progression no longer has value in guiding our expectations for the path of the economy. Said succinctly: is this time different?
Before we dive into our assessment of current conditions, we outline the mechanics that drive a typical recessionary process. Note that the biggest macro mispricing occurs around recessions as they are self-reinforcing income, spending, and employment downturns.
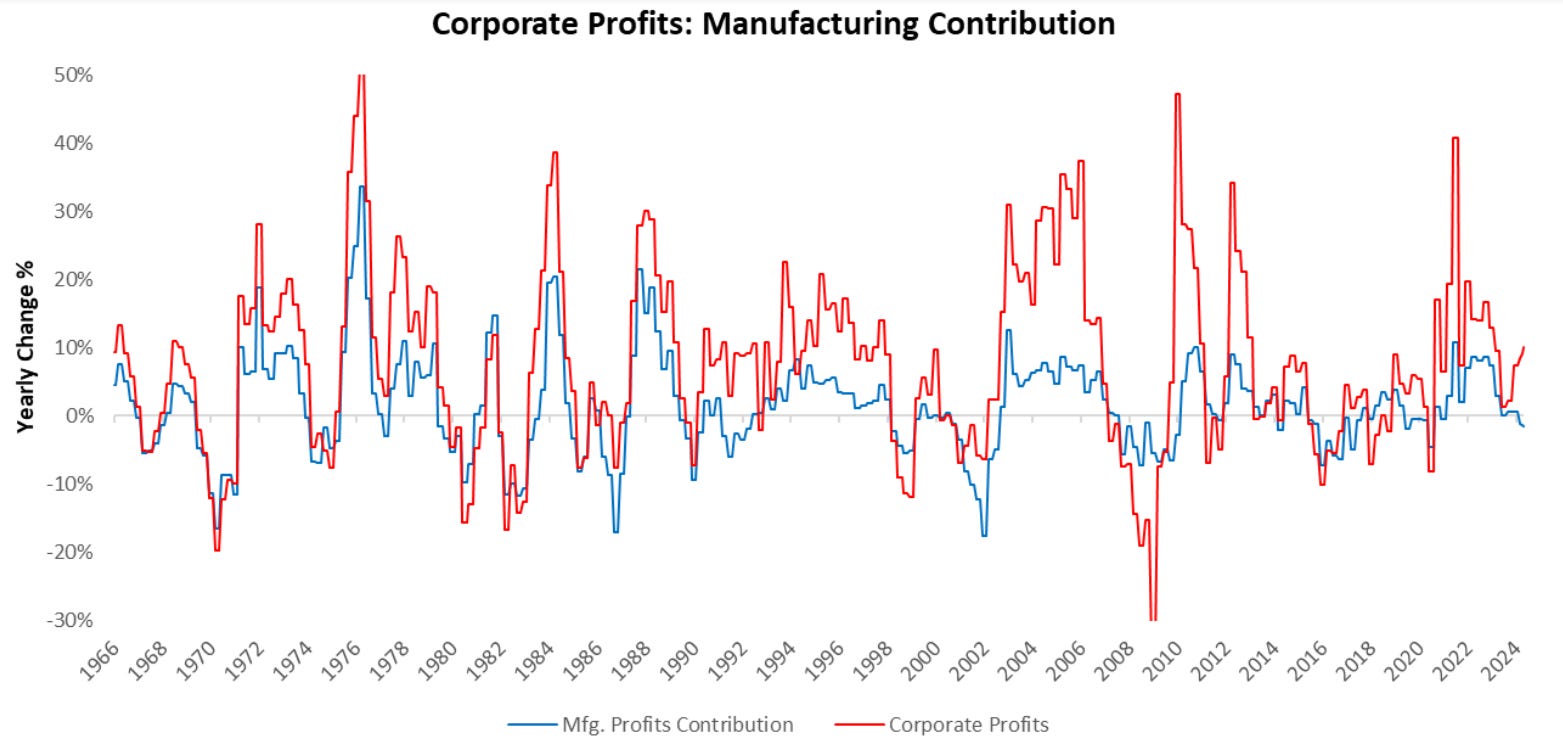
The recession process typically begins with a Fed that reacts to strong nominal activity by raising interest rates. The increase of these interest rates is not felt instantaneously through the economy but is immediately reflected in asset prices and new borrowing. Increased capital costs relative to an ongoing pace of nominal revenues deter further borrowing. This reduced pace of borrowing stifles business investment, which is the primary driver of corporate profitability. If the tightening, relative to the ongoing pace of nominal revenues, is large, the pullback in the pace of investment becomes large enough to put a significant dent in corporate profitability.
The contraction of corporate profitability, or the expectation of a significant hit to profitability, drives companies to reduce their costs- the largest of which are labor costs. To reduce profit pressures, companies begin to lay off workers. At this junction, the nonlinear aspects of a recession begin to rise; employees are both producers and consumers, and the removal of employees at a system-wide level has huge negative effects on income and spending. The cure to this dynamic is often through government intervention through monetary or fiscal easing, and it is often difficult to break a recessionary downtrend once it is ongoing.
To assess the breadth of recessionary pressures, we look at our broadest gauges of economic growth, i.e., our GDP Nowcast, along with our Growth Diffusion Gauge (75 sub-indexes). As we can see below, growth conditions remain strong across these measures.

Additionally, we zoom in to provide a detailed breakdown of the current growth conditions. For the latest data through June, our systems place Real GDP growth at 2.26% versus one year prior. Below, we show our monthly estimates of Real GDP relative to the official data:
In June, GDP came in at 0.12% versus the prior month. Below, we show the weighted contributions to the most recent one-month change in real GDP, along with the recent history of month-on-month GDP. Additionally, we show the contribution by sector to monthly GDP in the table below:

We share the monthly data in a tabular format below:

In June, real consumption spending increased by 0.17%. Over the last year, consumption has added 1.66% to GDP growth of 2.26%.

In June, real gross investment decreased by -0.02%. Over the last year, investment has added 0.72% to GDP growth of 2.26%.

In June, real government expenditures increased by 0.04%. Over the last year, government spending has added 0.46% to GDP growth of 2.26%.

In June, real exports revenues increased by 0.01%. Over the last year, exports have added 0.09% to GDP growth of 2.26%.

In June, real import expenditures decreased by -0.08%. Over the last year, imports have subtracted -0.68% from GDP growth of 2.26%.

Additionally, we show the composition of monthly estimates of nominal GDP, broken into real GDP growth and inflation. Our latest estimates place nominal GDP at 4.97% versus one year prior.

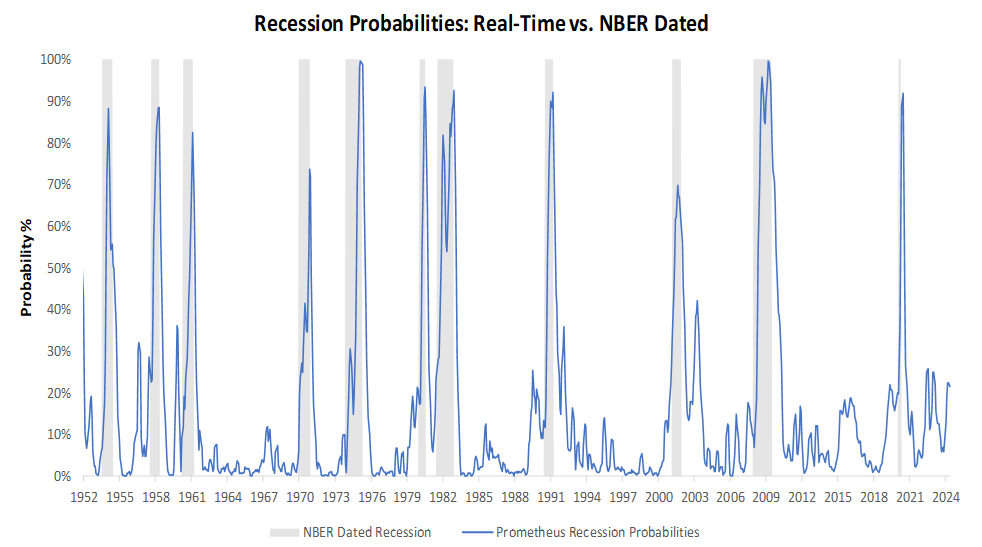
Furthermore, for a timely insight into recessionary pressures, we aggregate macroeconomic indicators, consistent with the NBER methodology of recession classification, into a recession probability monitor. This gauge gives us a real-time understanding of developing recessionary pressures. Currently, recession probabilities remain muted at 22%.
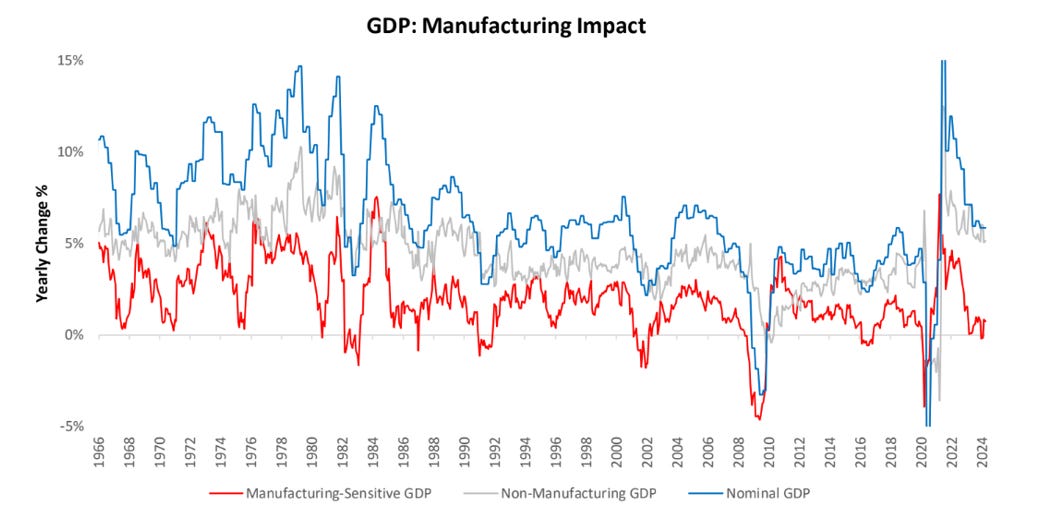
Now, while the above explains the high-level path the economy takes to get to a recession as well as the current nominal growth dynamics, there is considerable dispersion in the distribution of these recessionary pressures. Some industries are extremely sensitive to these business cycle conditions, while others are impervious.

Crucially, the business cycle-sensitive industries cause a recessionary process to begin. These industries, ranging from household durable goods to real estate investment, are capital-intensive businesses, often in both their production and consumption. As capital costs rise, these industries face far more significant headwinds than the broader economy.
Furthermore, it is these industries that initiate the unemployment cycle. It is crucial to recognize that the disproportionate deterioration of these industries ultimately explains business cycle slowdowns. Importantly, there is no single industry that can explain all economic downturns over time, but it is the confluence of conditions that drives recessions.
Given this nuanced understanding of the recession transmission mechanism, we think it is imperative not just to analyze the economy's path relative to the economic high-level template but to have a bottom-up & granular understanding of all industries to ascertain which are experiencing the most stress.
In line with these principles, our tracking of these pressures on an industry-by-industry basis has begun to show growing pressures, both across the broad economy and concentrated within the manufacturing sector. While the pressures we see in the broader economy continue to look consistent with a slowdown, the conditions in the manufacturing sector look consistent with a contraction. These pressures are consistent with the recessionary archetype we outlined above- the manufacturing sector carries a significant debt load relative to the broader economy, with debt service payments exceeding the current revenue growth rates.
Furthermore, manufacturing revenues remain outpaced by ongoing labor costs. The combination of these dynamics continues to put pressure on manufacturing profitability. The likely release value for these pressures will be manufacturing layoffs, which will likely have nonlinear ramifications on the broader economy. We have recently seen early evidence of these pressures with extremely weak/negative manufacturing job data.
From a balanced perspective, however, it is important to note that these manufacturing pressures have somewhat abated with recent data. Furthermore, the weakness is inadequate to take down the broader economy. Therefore, in the near term, the manufacturing economy is likely to contribute to the ongoing slowing of the US economy rather than be the catalyst that pushes it into a recession.
The combination of these sector-specific dynamics and broader business cycle conditions suggests that the US economy has moved from a cyclical reacceleration to a regime of Slowing but Growing. This environment significantly differs from that we have seen year-to-date, particularly for asset markets. A slowing but growing economy is much more favorable for equities and bonds and much less favorable for commodities.
Now, a precise expression of these views requires a case-by-case examination of what's priced in for those markets and is beyond the scope of this note. Nonetheless, we think the big-picture understanding, i.e., that slowing but growing is good for stocks and bonds vs commodities, remains a reasonable guide for most investors.

Last, we think an extremely important understanding of these conditions is that the continuation of the dynamics that feed Slowing but Growing eventually leads to recession, but we are not there yet. The economy is showing a lot more weakness than it has in the recent past, and caution (not panic) has started to become appropriate. Until next time.
Is the subscription to the macro Asset allocation portfolio a different expense from the 3 ETF portfolio which I already subscribe to and on what basis would I choose one over the other?