
Basic Trend Program
Overview & Extended Universe

We continue to provide access to a Basic Trend Program at zero cost to users for a portfolio of Stocks, Gold, Bitcoin, and Bonds. We also provide trend signal extensions across a broad mix of ETFs for those looking to apply the approach to other assets.
For those interested in understanding our Basic Trend Program, you can read the overview below. For those just looking for updates to positions or signals, you can scroll to the section labeled as such.
Basic Trend Program: An Overview
We think a basic trend program stacked on beta is one of the most defensible things an investor can do. It is intuitive, empirically supported, and consistent with how most people actually behave when markets move against them.
That is not how it is usually sold. A large number of participants — in both mid-tier institutional and retail strategist settings — are trend following and then shrouding that trend following in marketing and elaborate analysis. “Long-term fundamental views, with technical execution” is often the tell. What is being sold is two return streams: a view component and a trend component. The trend component dominates the positions, the execution, and the performance. The view component rarely carries an edge. We are releasing the trend component in full so it can be judged on its own.
We also think the barriers to entry in trend following are close to zero. The cost of replicating it should be too. This gives you a benchmark against which to evaluate any market strategist and a portfolio you can run yourself with a brokerage account. We dive into our process below.
Benchmark Selection
We begin with a benchmark of 60% stocks, 15% bonds, 15% gold, and 10% bitcoin. The stocks, Gold, and bitcoin portfolio advocated by Paul Tudor Jones has become popular recently. We add bonds back because dropping the primary defensive asset is a mistake. The weights are simply a reorganization of the classic 60/40, dividing the bond allocation across bonds, Gold, and bitcoin. This reflects the popular zeitgeist without going overboard. Are these weights optimal? No. But they span the assets most investors actually hold and roughly account for their volatility, which is enough for a benchmark.
Two-Speed, Binary Trend
Trend following is a well-established way of investing. Economies move in trends, and asset markets move to reflect those trends. When you trend-follow large, liquid markets that carry opposing economic biases, you get a portfolio that adapts to the macroeconomic environment. There is far more information in the trend of stocks, bonds, and commodities than there is in the top ten stocks. The benchmark above is a good base to follow. We use two look-back windows, one month and six months, and take a binary reading of each:
Both trends positive: full position.
Trends opposed: half position.
Both negative: flat.
We do not apply shorts here. Shorting is more expensive and introduces more management. More importantly, these assets carry an upward drift over time, and shorting them successfully requires a more tactical approach than this program is designed for. Why those look-backs? They are not optimal in any formal sense. They conform to the behavioral tendencies we observe in most investors. When markets are crashing, the one-month trend sizes you down. When markets are rallying from the lows, the six-month trend keeps you participating. Pick your own look-backs if you prefer; this is not a religion.
Risk Parity
We now have a portfolio that sizes a 60/15/15/10 allocation up and down on two trend speeds. That is already a reasonable place to stop, but there are easy gains available through risk parity. Risk parity is the idea that every asset should contribute equally to portfolio risk. We measure risk through volatility. So instead of the somewhat arbitrary 60/15/15/10 weighting, we weight each asset inversely to its volatility. Asset weight is expected return divided by volatility, relative to the rest of the universe. The implicit assumption is that all assets carry the same expected return. We adopt that assumption here; if you disagree, substitute your own. This ensures every asset is equally represented. The binary trend signal then scales the risk-parity weights: all clear gives the full allocation, mixed gives half, and both negative gives zero.
Dynamic Leverage and the Volatility Targeting
We now hold a package of assets with an expected volatility conditional on its holdings. We would prefer that the risk profile be deliberate rather than incidental. The goal is to take risks when it is warranted. When is it warranted? When the portfolio is diversified and when there is conviction. Both conditions are already encoded in the trend signals, since signals translate directly into positions, and positions into breadth. So we scale target volatility by the number of positive trend signals. We set the maximum volatility to 15% — roughly the midpoint of long-term volatility for this asset set, though any number will do. With four assets and two signals each, there are eight signals and therefore eight discrete levels of risk:
Eight positive signals: 15% volatility.
Four positive signals: 7.5% volatility.
Zero positive signals: no exposure.
And everything in between. This gives a profile that takes the most risk when the portfolio is most diversified and steps down as breadth deteriorates. Set the maximum wherever you like, but the principle holds: more diversification, more Sharpe, more room for risk.
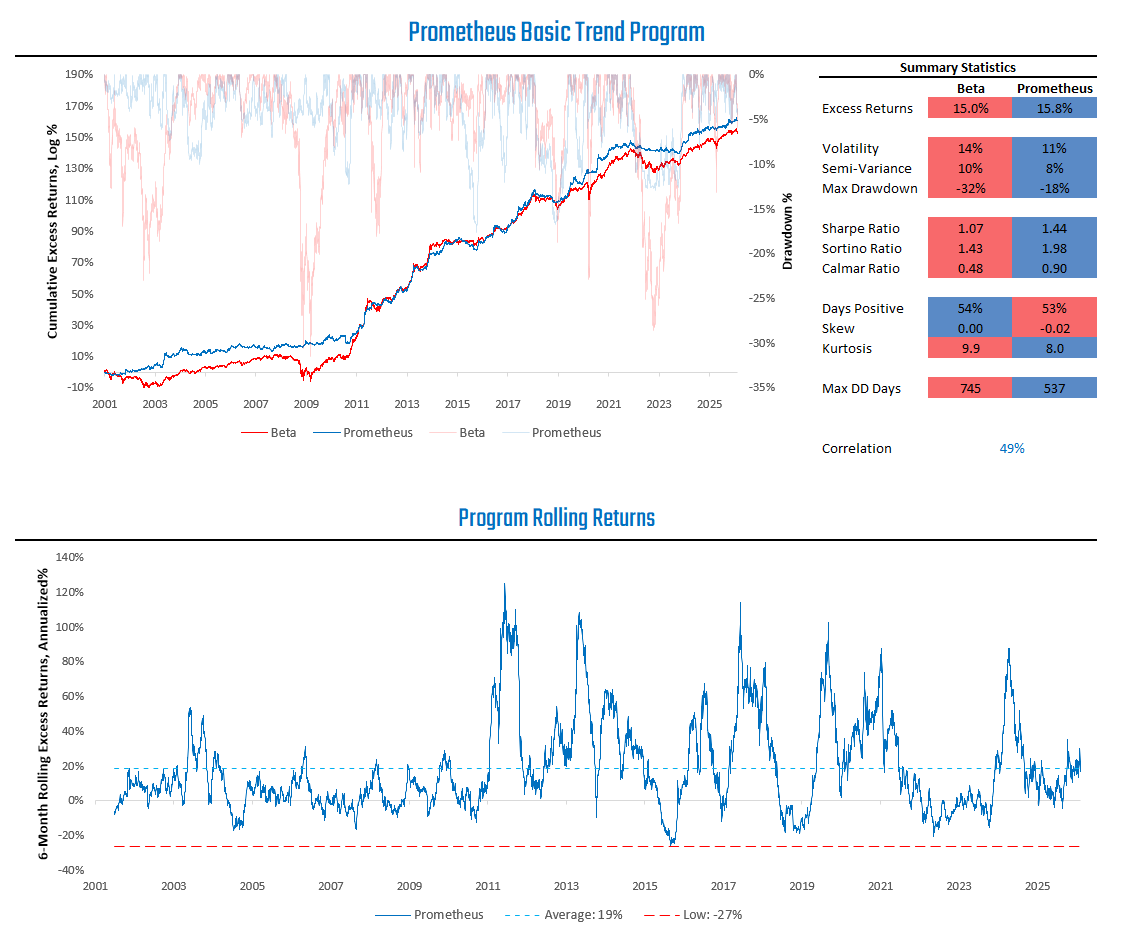
Stacking these layers produces the Prometheus Basic Trend Program. It outpaces beta and cuts drawdowns considerably, all from relatively simple components. We show the simulated path of the program below:
If you like this approach, you can follow it for free on Prometheus. If you would rather not, use it as a template and build your own. For those interested in following along here, find the latest positions and trend signals below.
Basic Trend Program: Positions & Extended Universe
Below, we show the latest positions from the Basic Trend Program:
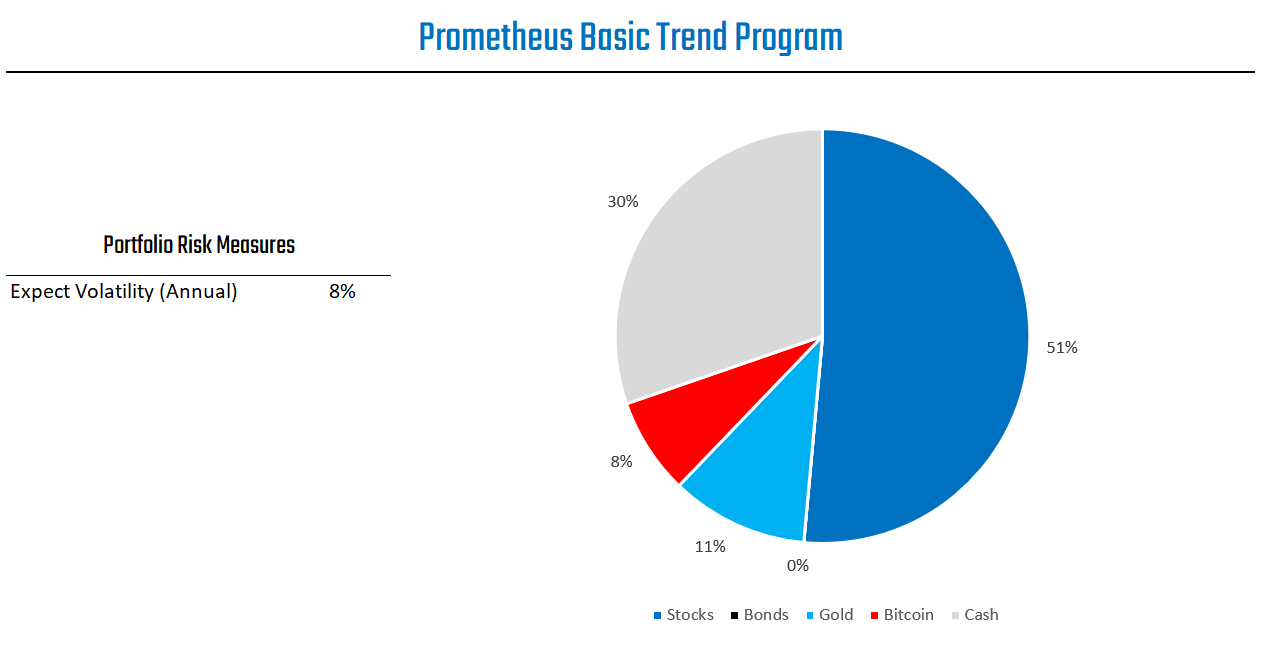
This program currently has a 100% max long position in Stocks, a 0% max long position in Bonds, a 50% max long position in Gold, and a 50% max long position in Bitcoin.
In risk-parity terms, this translates to Stocks: 51%, Bonds: 0%, Gold: 11%, Bitcoin: 8%, and Cash: 30%. This reflects an expected volatility target of 8%.
For those interested in applying this approach to a broader set of ETFs, we show the latest two-speed binary trends across a wide variety of assets below. The color key below reflects whether trend signals are bullish (both trends positive), bearish (both trends negative), or neutral (trends mixed):
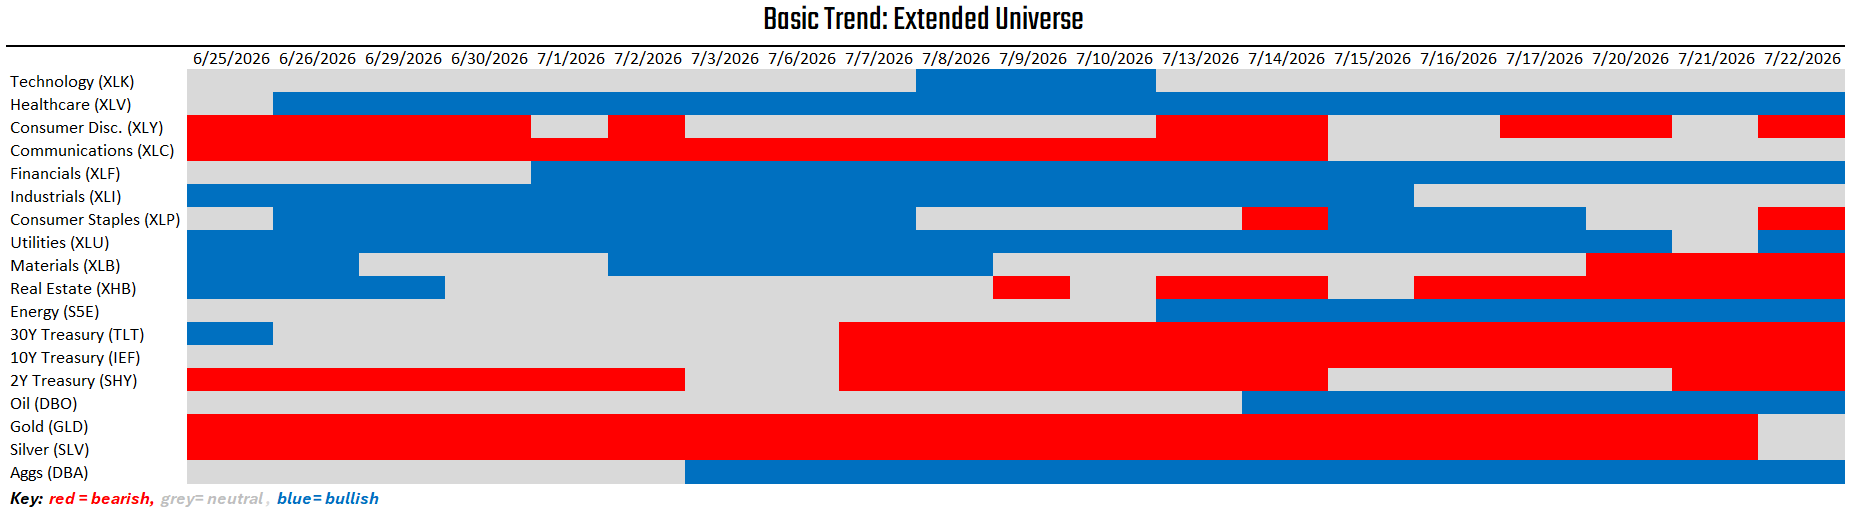
Asset market trends are broadly mixed across the extended universe.
Until next time.