

We scan through the latest industrial data to understand what it means for metals and equities.
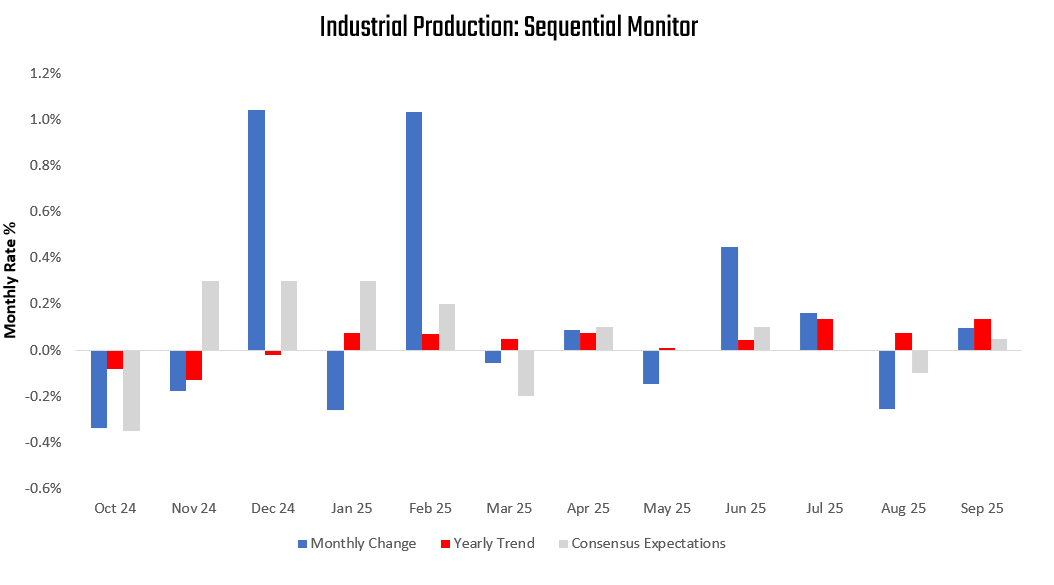
The latest data for September shows Industrial Production increased, coming in at 0.1%. This print surprised consensus expectations of 0.05% and contributed to a deceleration in the three-month trend relative to the twelve-month trend. We show the sequential evolution of the data below:
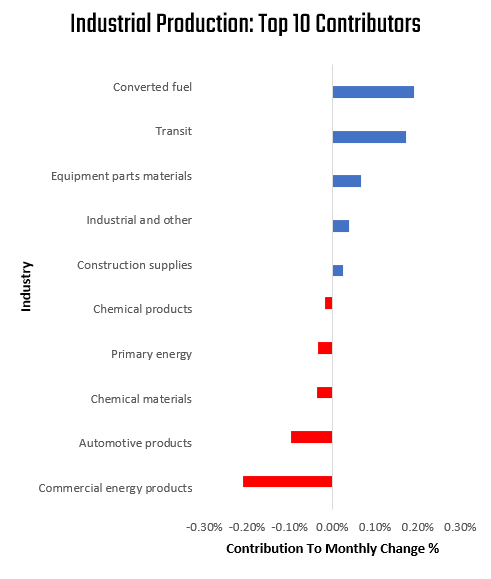
We break this print into its contributions from production coming from Food (-0.01%), Energy (-0.05%), Autos (0.08%), and All Other Items (0.08%). Additionally, we also showcase the top 10 contributions by industry. The largest contributor this month was Converted fuel, and the largest detractor was Commercial energy products:
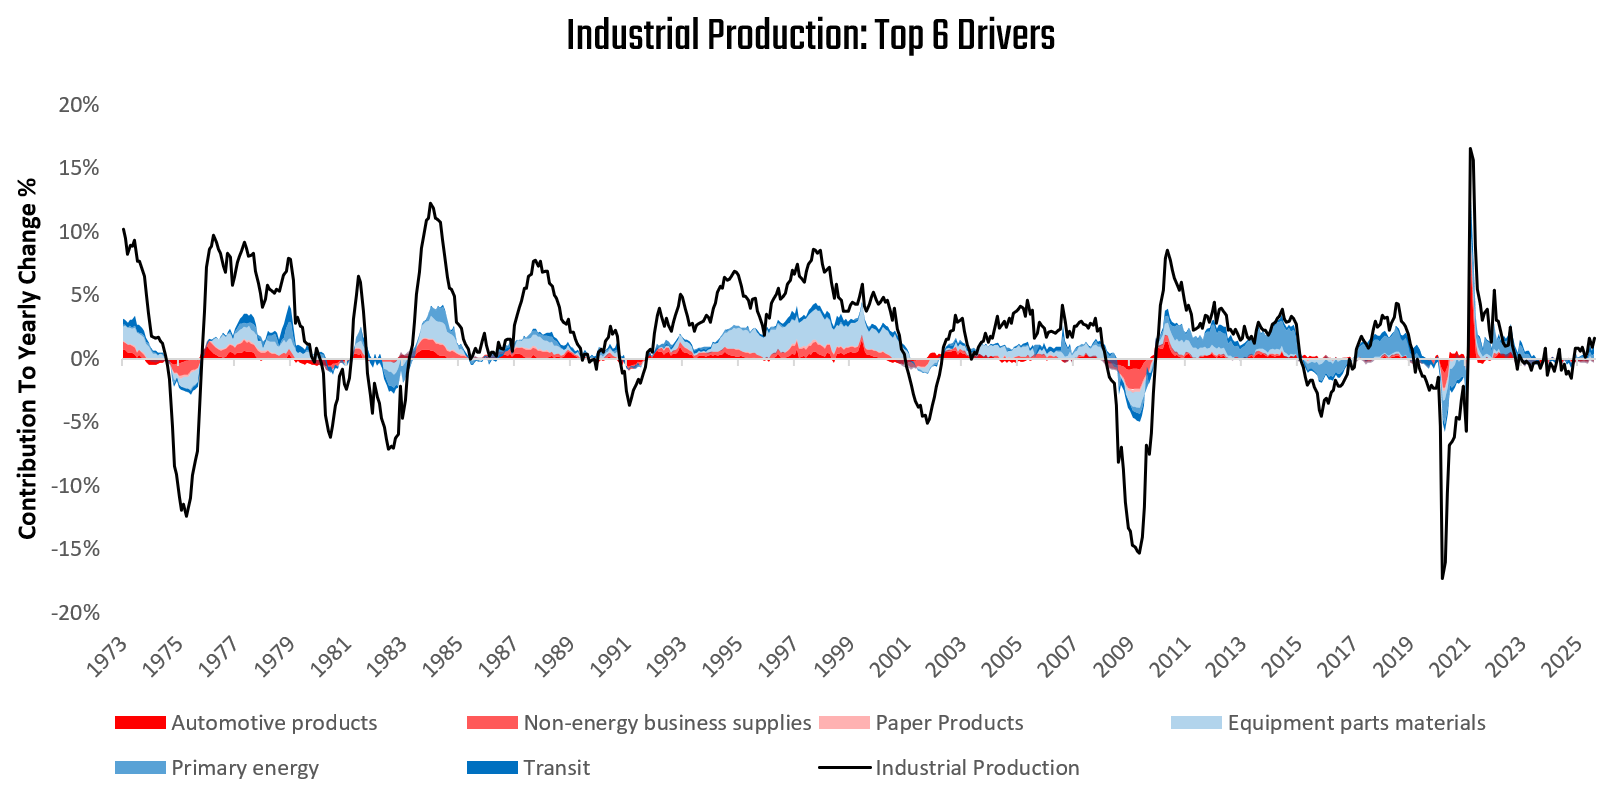
We zoom out to offer further context on the dynamics of industrial production. Over the last year, industrial production has expanded by 1.62%. Below, we present the top six drivers of industrial production, with the three strongest industries highlighted in blue (Transit, Primary energy, and Equipment parts materials) and the three weakest industries highlighted in red (Automotive products, Non-energy business supplies, and Paper Products):
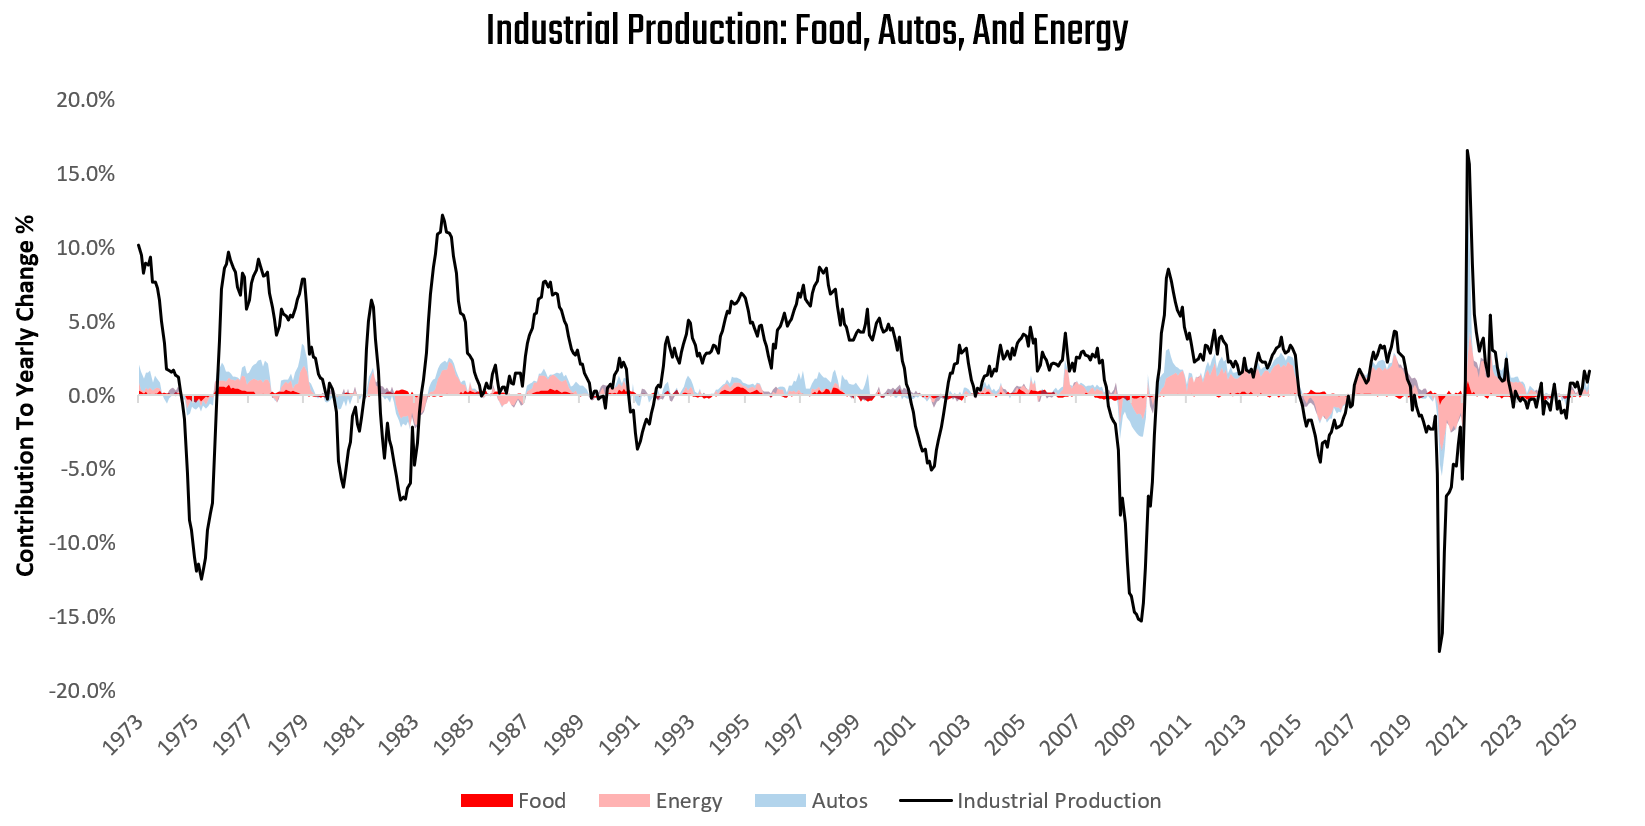
Over the last few decades, the importance of food, energy, and automobiles has risen, accounting for a significant amount of the variation in industrial production. Over the last year, food, energy, and automobiles have contributed 1.2% to the 1.62% change in industrial production. We show this impact below:
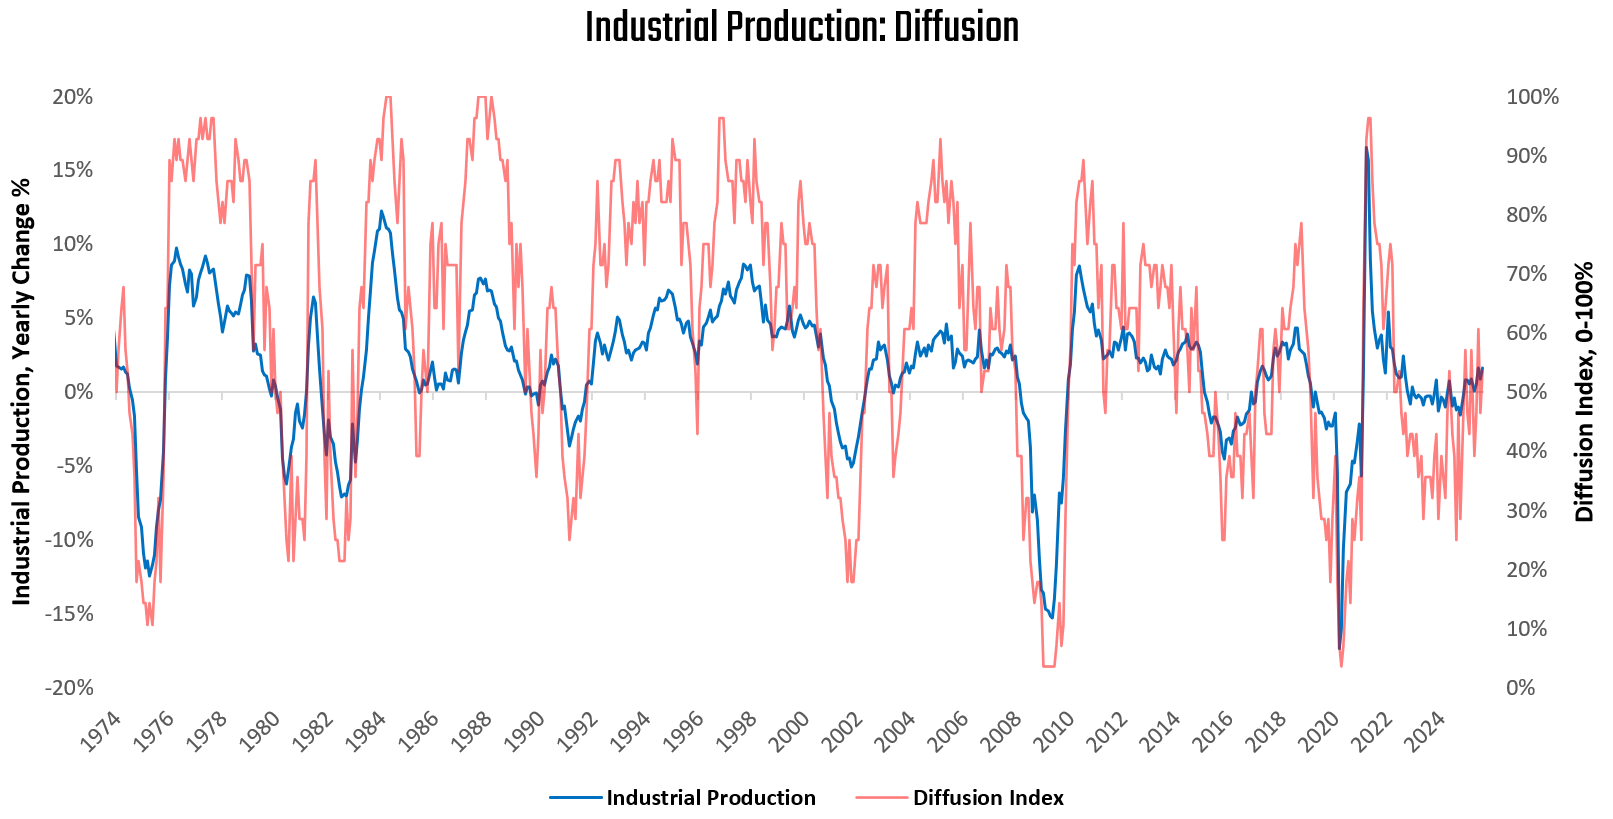
To further assess the health of the current expansion of industrial production, we examine the diffusion of the 28 subsectors we track. This involves examining the number of industries that are expanding versus the number of industries that are contracting. We find that 46% of industries are contracting. Below, we visualize how a diffusion index has generally been a good barometer of the durability of upturns and downturns in industrial production:
To elaborate further, currently 15 industries are expanding and contributing 2.62% to industrial production, while 13 industries are contracting and detracting -0.57% from industrial production growth year over year. We visualize their respective weighted contributions below:
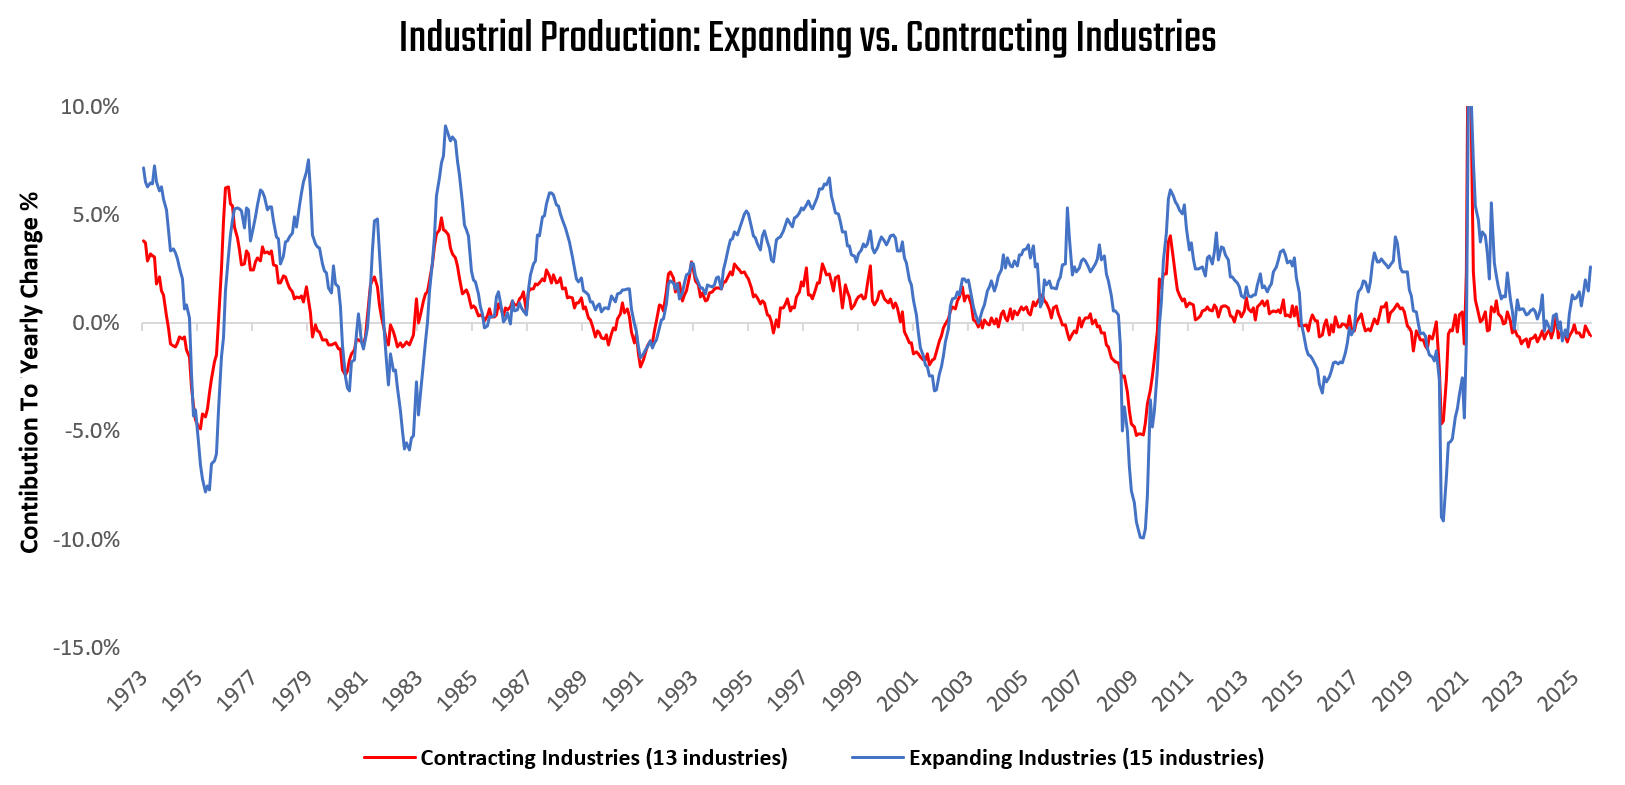
Therefore, we are seeing increasing signs of a recovery from previously contractionary conditions.
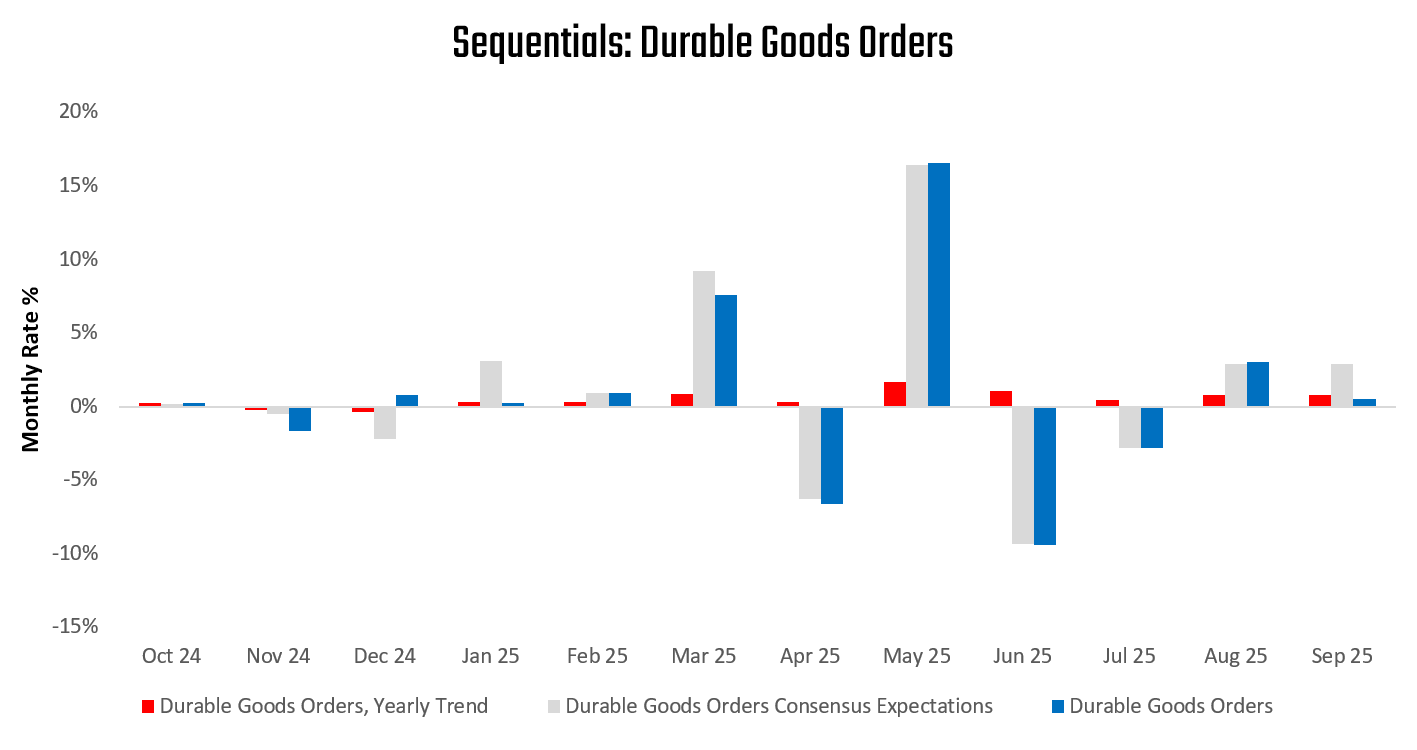
This is corroborated by the latest available manufacturing orders data as well. The latest data for September showed manufacturing new orders for durable goods increased by 0.51%, disappointing consensus expectations of 2.9%. This print contributed to a deceleration in the quarterly trend relative to the yearly trend. Below, we show the sequential evolution of the data relative to consensus expectations:
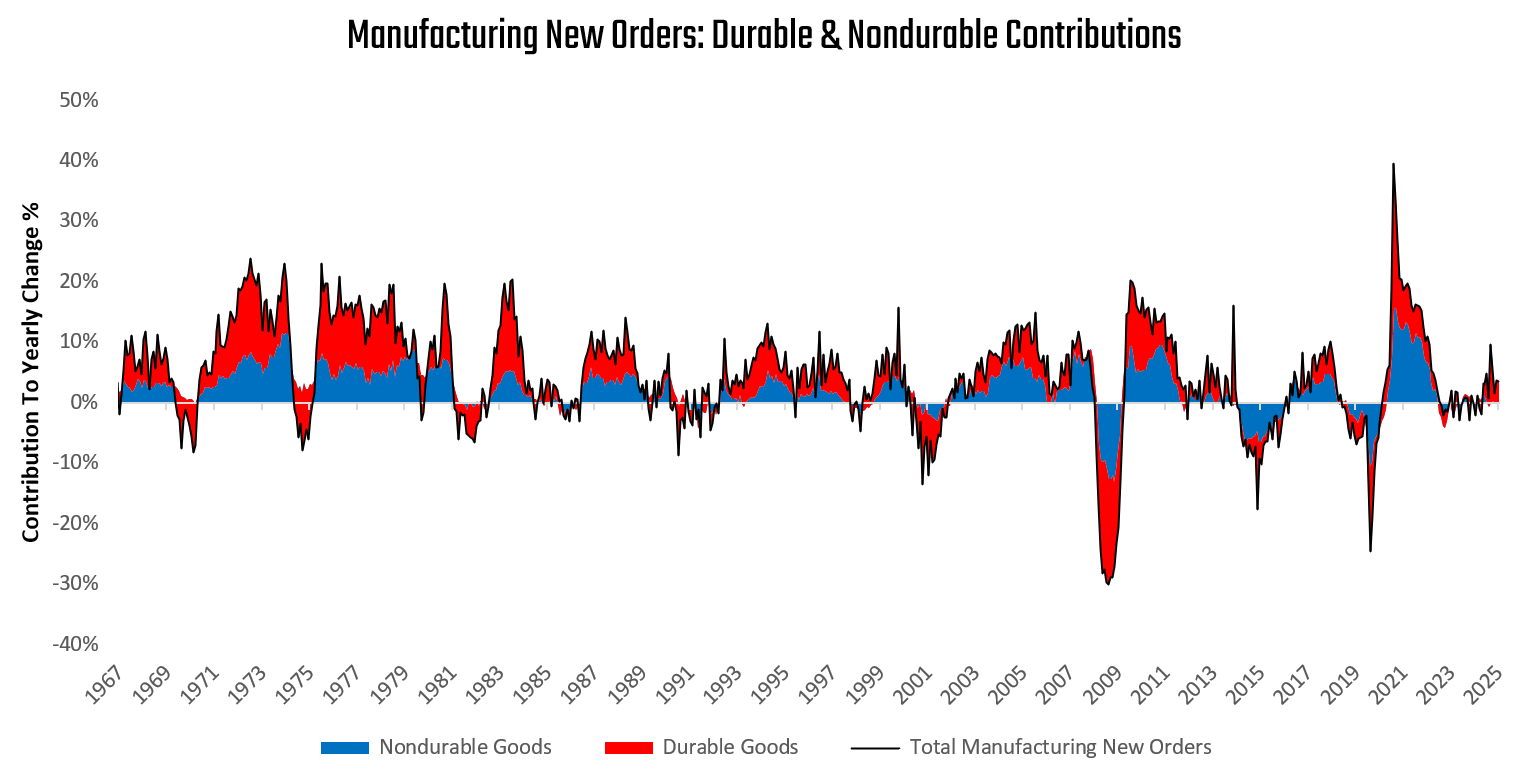
This data, along with the latest nondurable orders data, places total manufacturing new orders growth at 0.37% in September. Over the last year, manufacturing new orders have grown by 3.55% compared to one year prior. Below, we show the contributions coming from durables (3.59%) and nondurables (-0.04%) to these changes in total new orders:
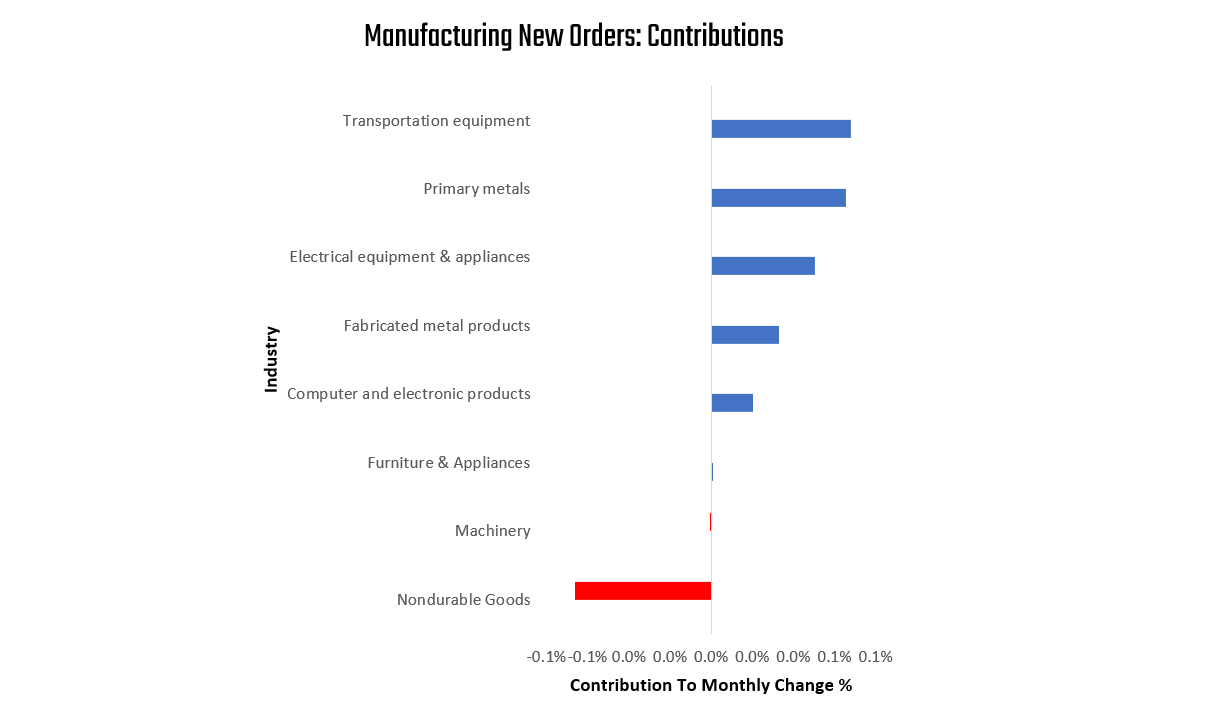
We now zoom into the most recent print. Below, we show the composition of the most recent data for manufacturing new orders. Please note that we include our estimates for nondurable goods if the latest data is not yet available. The largest contributor to the most recent change in manufacturing new orders is Transportation equipment, and the most significant detractor was Nondurable Goods. We display the composition below:
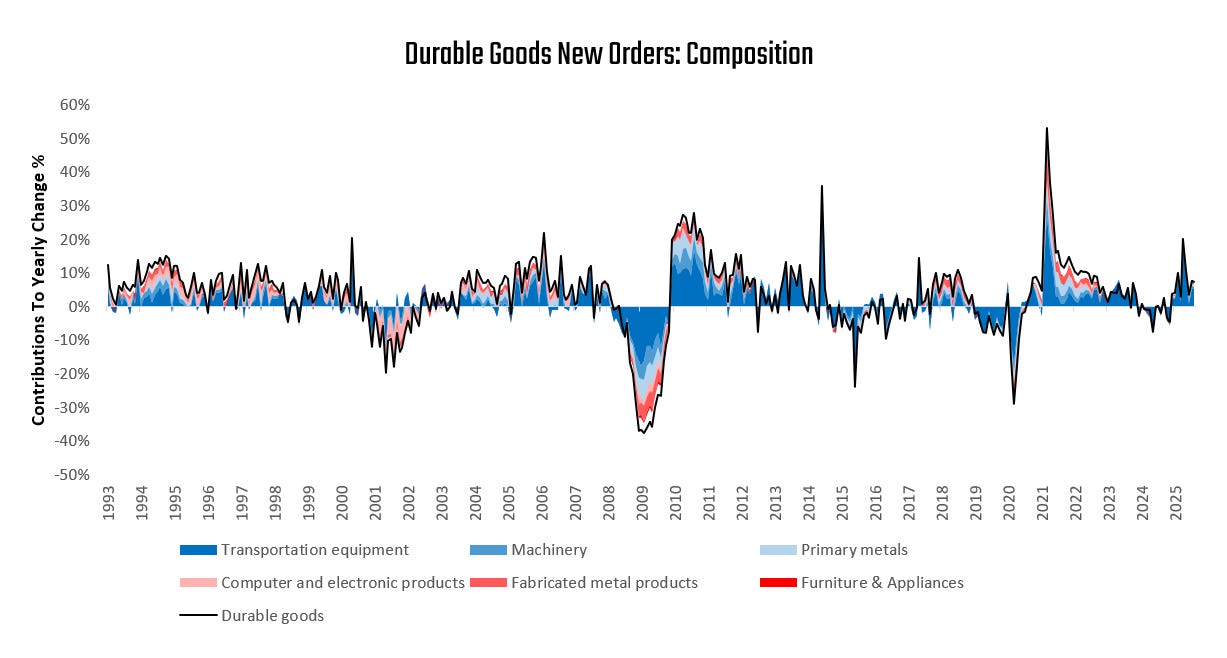
To better understand these changes over the last year, we decompose durable goods orders by industry. Over the last year, Transportation equipment, Machinery, and Primary metals have been the primary drivers of strength in durable goods orders, as shown in shades of blue below. On the other hand, Furniture & Appliances, Fabricated metal products, and Computer and electronic products have dragged on growth, as shown below:
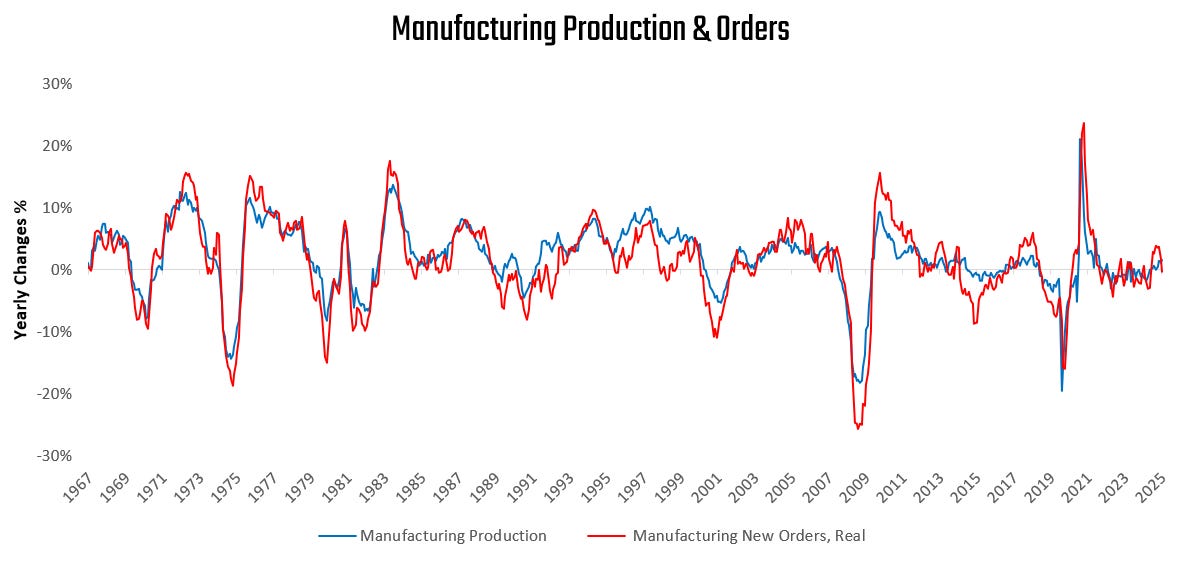
Real manufacturing orders and industrial production move hand-in-hand, with new orders fueling output. Currently, orders are consistent with the latest industrial production data, suggesting positive conditions continuing to develop:
To understand how these industrial production dynamics are reflected in equity markets, we turn to examine earnings expectations for US industrials and compare them to the underlying output of industrial equipment. Over time, we find that industrial output is a primary driver of industrial earnings.
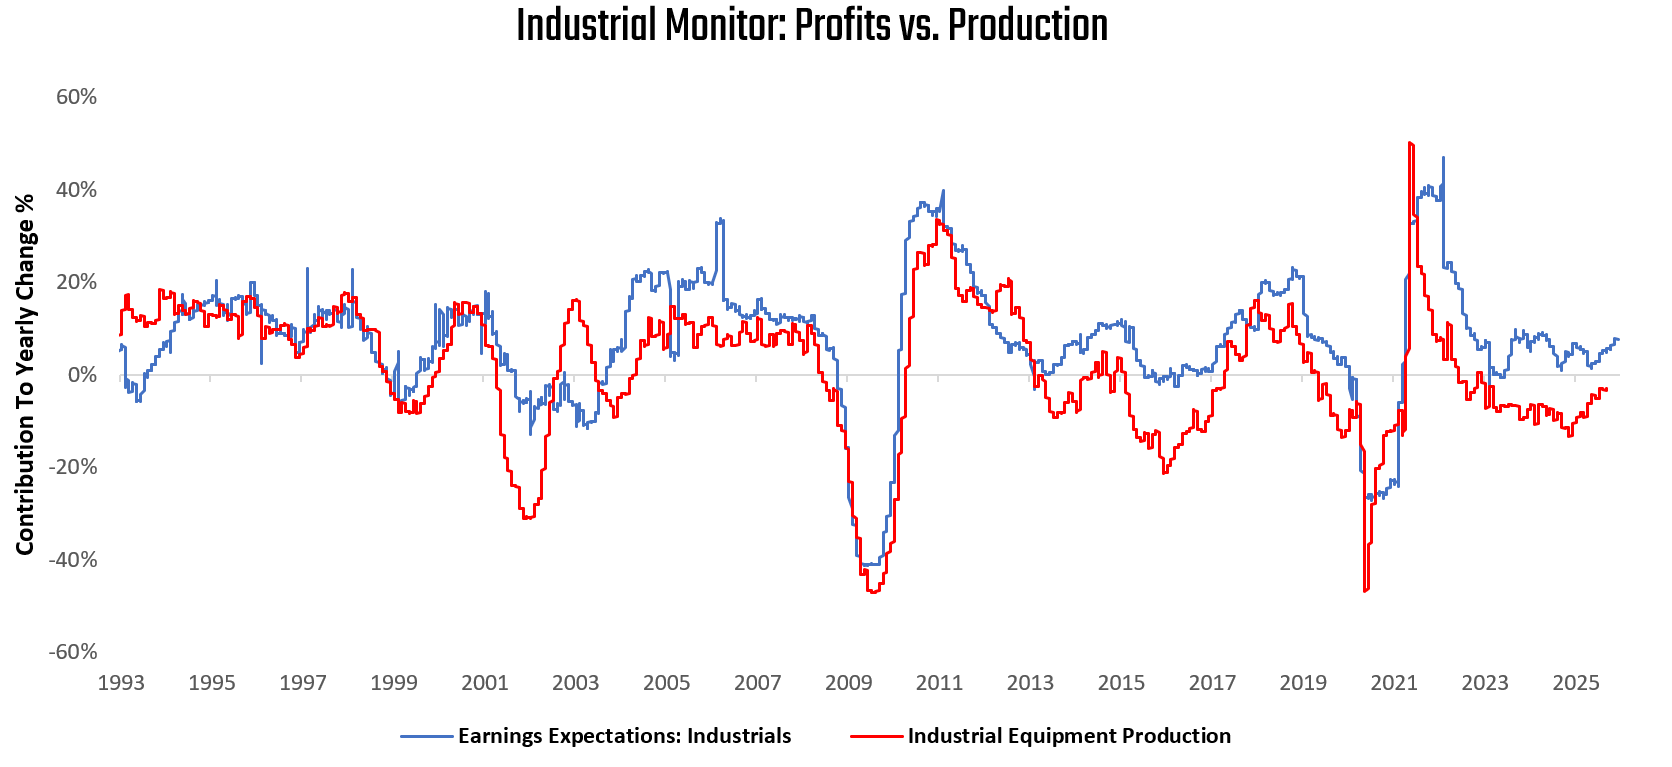
Today, earnings expectations for the industrial sector are in a sequential acceleration within an expansion, while production is in a sequential acceleration within a contraction.
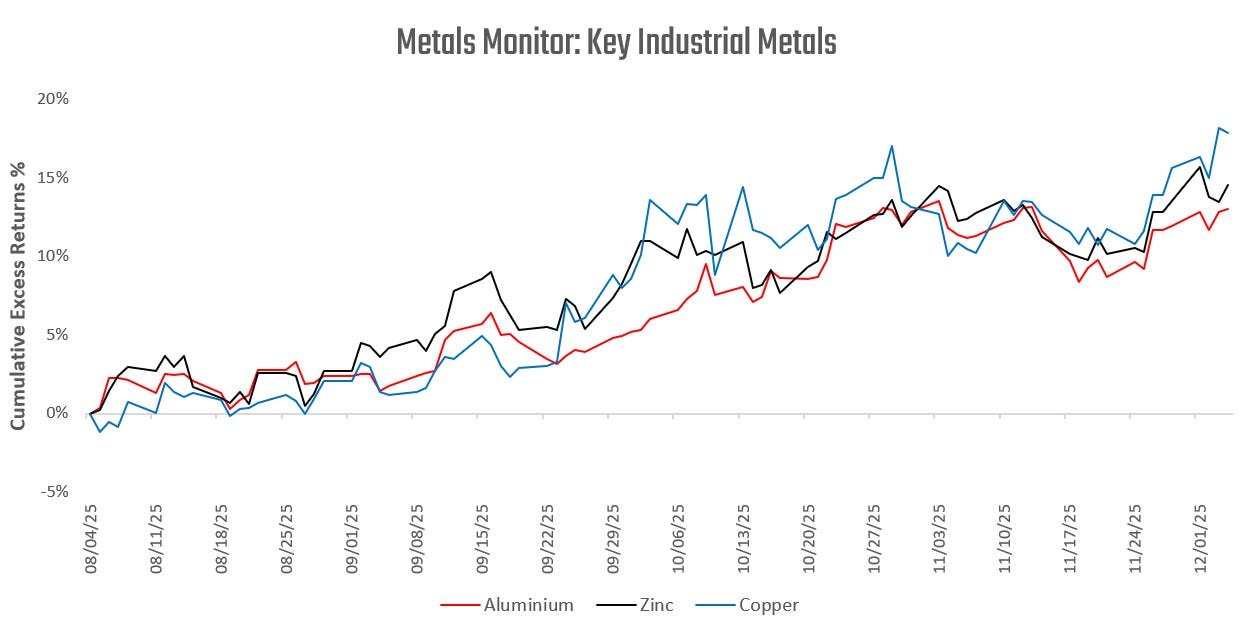
Alongside these indications of improving US conditions, we have also begun to see bellwethers of global industrial activity in the form of industrial metals begin to show significant trend strength:
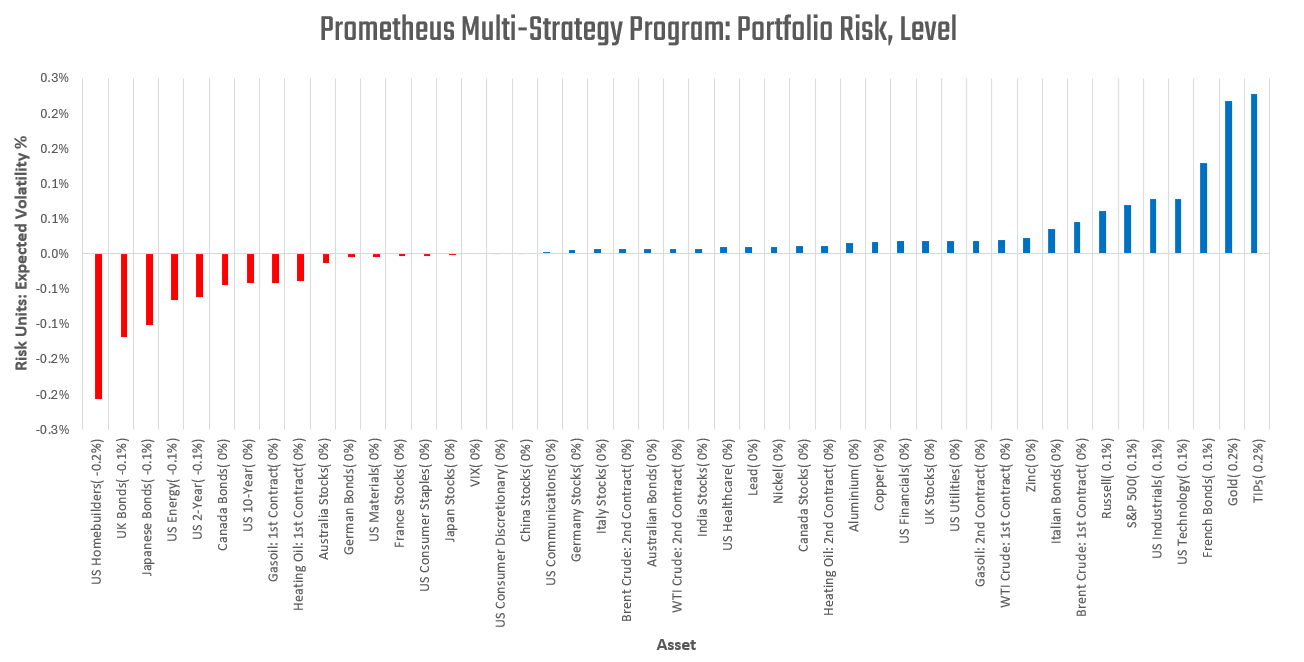
The combination of these dynamics has moved the Prometheus Multi-Strategy Program to maintain its net long exposure to US industrial equities and metals. We visualize our latest risk below:
The early stages of a recovery are often the most positive periods for industrial commodities. The future is dynamic, and our systems will adapt as the data evolves. We will keep you updated as the outlook shifts. Until next time.
It’s interesting how much of the “recovery” is tied to specific capex pockets rather than underlying demand.
"Converted fuel" is corn-based ethanol?